
The navigation officer at the chart table, equipped with ruler, compass and pencil, bent over the official nautical chart in huge DIN A0 format. This is a familiar image from various films that are supposed to give us an impression of how a ship’s course data is determined and set. Chart tables and official nautical charts in paper format still exist on modern sealiners. This is the mandatory program.
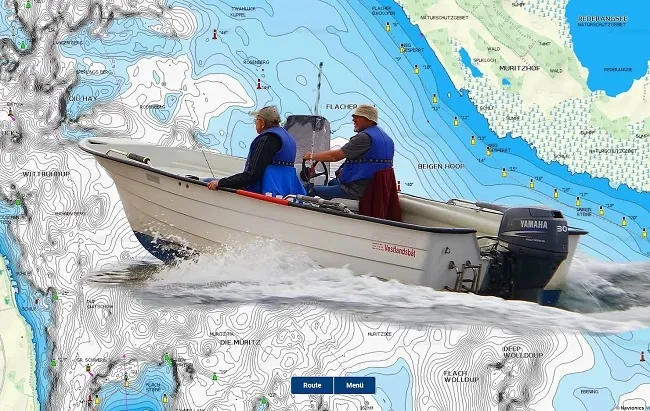
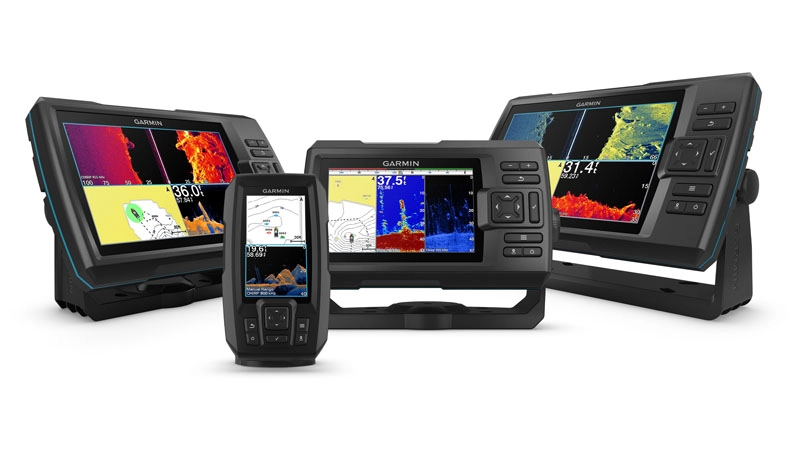
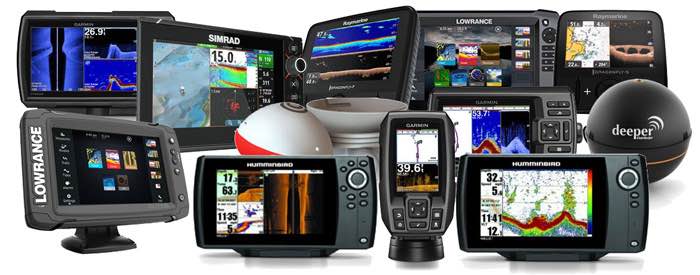
But the digital age with electronic nautical charts has been a part of navigation on the water for a long time. With these, the position and course of the ship are visible on a chart plotter. This technology has also made its way to the recreational sector – and thus for us anglers – and should be part of the standard boat accessories when traveling on large bodies of water.
Many anglers still believe that a fish finder is the most important tool for catching fish. However, lake anglers and those who frequently travel on large lakes know that the chartplotter, in conjunction with nautical charts, makes a far more important contribution to finding fish than many a fishing enthusiast assumes.
In any case, in seafaring, the chartplotter is much less dispensable than the depth sounder. We want to show you in this article, that as an angler you should be focused on a “chartplotter with depth sounder module” and not vice versa.
Table of Contents:
- What is a chartplotter? (And how does it work?)
- What is the Global Positioning System (GPS)?
- How does GPS tracking work?
- SBAS, WAAS, EGNOS and MSAS: Why do GPS signals need to be corrected?
- How do digital maps and GPS data fit together on the chartplotter?
- How does the lake navigation with the chartplotter?
- How important are good charts for the chartplotter?
- What advantages does the chart plotter offer us anglers besides navigation? (Examples from practice)
- Which charts are recommended for chartplotters?
- Why Live Mapping is a useful chartplotter addition.
- Which is the best chartplotter? Test with device recommendations!
1. What is a chartplotter? (And how does it work?)
Electronic nautical charts are data that originate, among other things, from official sources of a country. They are combined in smaller units (the so-called tiles) to the desired sea area and stored in a special data format on data media.
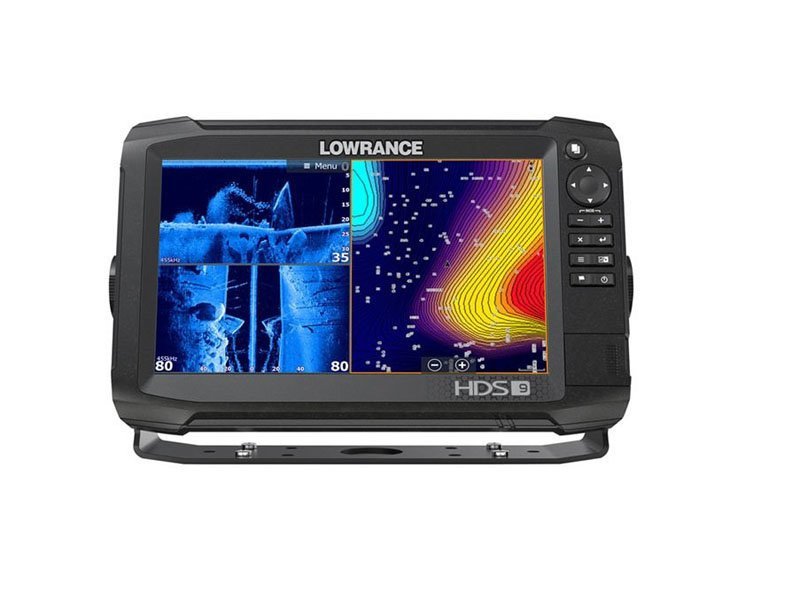
This data can be read by a device (the mentioned chartplotter) and made visible on its screen. From a strictly technical point of view, a chart plotter is a small computer with a processor, RAM and an operating system. In terms of its layout, it corresponds most closely to a tablet that has been adapted for a specific use.
The most important equipment detail of a plotter, apart from its computing unit, is the GPS module. Without this, it would be impossible to navigate with the charts read in.
-
The Ultimate Fish Finder Guide
Download 40 pages for free now
Reviews ( 17 )
2. What is the Global Positioning System (GPS)?
In the 1970s, the U.S. military developed a new positioning system that was to replace all previous individual solutions of various army units (e.g. the Navy). Under the abbreviation GPS (Global Positioning System), this system finally became fully operational in the 1990s.
Why this development took around 20 years becomes understandable when one consider the technical effort that was necessary. A global positioning system is not something that can be installed overnight.
First, a large number of satellites had to be launched into orbit and placed on various orbital planes. In addition, numerous ground stations were needed to ensure the accuracy of the measurements. And then, of course, well-functioning receivers were needed that were matched to the intended use.
Initially, GPS was only available for military purposes. Civilian use without restrictions only became possible at the turn of the millennium, after an artificial signal degradation was switched off.
Today, it is possible for everyone to determine positions via the GPS system, which can be accurate to about one meter. However, this requires the use of certain alignment systems, which we will discuss in more detail later.
3. How does the GPS tracking work?
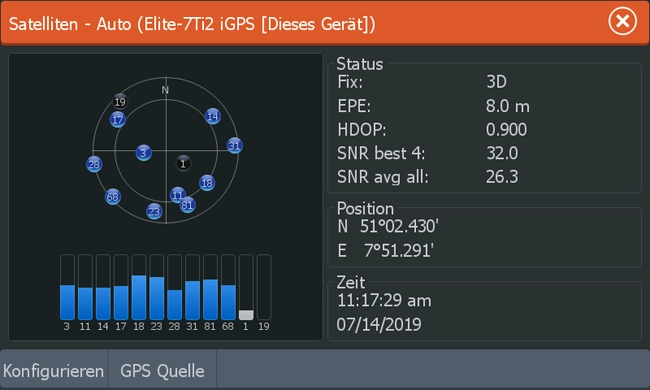
We first assume that there are so many satellites on various orbital planes around the world that successful GPS receptionispossible from most places on earth around the clock. Reception is successful when the receiver has found the minimum number of three sufficiently strong satellites. This condition is called a GPS FIX.
With these three signals a position determination is possible, but unfortunately with very poor accuracy. To improve this, a fourth celestial body is needed for alignment. Technically, it works like this: Each satellite sends a coded radio signal, which contains its position and the exact time.
The position of the satellite in space and the difference of the own and transmitted time (= propagation time of the signal) are the values with which the own position can be determined. Unfortunately, the time measurement values of the “inaccurate” receiver clock are not exact enough to allow an accurate position determination. Therefore, a fourth satellite is still needed for alignment, with which the receiver time can be determined more precisely.
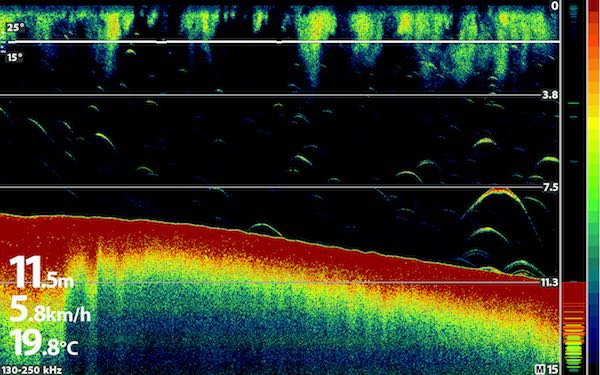
The GPS signal can be used to determine the position of the receiver as well as its speed and direction of movement. The speed of the receiver is determined e.g. via the Doppler effect. This describes the change of the running time during the signal duration, which results from the change of location of the receiver (boat) (see figure).
It can also be used to determine the direction of movement of the object. Electronic compass measurements, which are possible with GPS devices, are based on this method. However, this means that a digital compass only works while the receiver is moving, as this is the only way to set changes in transit time.
Conversely, this means: no movement, no compass. Therefore it is also possible to calculate the speed of the receiver mathematically instead of using the Doppler effect. Such calculation models come from a subarea of the analysis, which examine facts of functions (here e.g. a way-time function) by derivations (differential calculation). These derivatives provide information about the instantaneous velocity of the object after time.
4. SBAS, WAAS, EGNOS, MSAS: Why do GPS signals have to be corrected?
In practice, the function of the GPS system is not quite as simple as described so far. On a path of around 20,000 m that the radio signal has to cover from the transmitter (satellite) to the receiver (GPS device), some things can falsify the time measurement.
Before the signal enters the atmosphere, which can have a meteorological influence, it must pass through the ionosphere. Depending on the conditions currently prevailing there, this also has an effect on the signal.
In addition, there are other interfering factors, e.g. reflections, which can even render the signal unusable. One of the main focuses is on the influencing factors in the atmosphere.
Among other things, this problem has been addressed by a comprehensive extension of the GPS system, the SBAS (Satellite Based Augmentation System), which consists of various continent-based components.
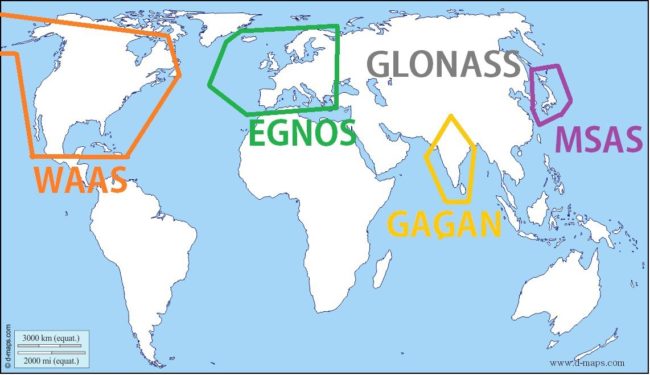
The WAAS (Wide Area Augmentation System) is available for North America,
in Europe, the EGNOS (European Geostationary Navigation Overlay Service) is used,
the MSAScoversJapan,
as well as the GAGANdoes forIndia.
Additional extensions are under construction worldwide, such as in Australia or Africa.
The basic principle of these GPS extensions is the collection and transmission of correction data, which are distributed via individual geostationary satellites. So that every GPS device, no matter how simple, can receive and process these data, they are sent on the same frequency as the actual GPS signal. To distinguish between the two pulses, the correction delivery has a higher satellite number as an identifier.
The collection of the data and the calculation of the correction factors are performed by ground stations installed throughout the area, which detect atmospherically caused errors in their coverage area and calculate the correction data from them. With this information, the WAAS/EGNOS-compatible GPS receiver can determine the signal’s travel times much more precisely.
Deviations from the actual value are between 0.3 and 1 m after correction. Without this, only position determinations with a tolerance frame of 5 to 15 m would be possible. Unfortunately, the use of the correction techniqueis associated with two disadvantages:
Increases the power consumption of the GPS receiver not insignificantly.
The reception of WAAS/EGNOS signals is strongly dependent on the location of the receiver.
This means that correction on the open sea and in higher regions usually works without problems. Mobile receivers on the ground – especially in cities – have to manage without this help because the correction satellite is “shadowed”.
5. How do digital maps and GPS data fit together on the chartplotter?
We simply imagine the following picture: There is a paper map on the table that shows our current cruising area. We simulate the position of our boat with a laser pointer. This meanswith a small red luminous point, which moves according to the boat movement, on the map.
By looking at a more or less large section of the map, we can see in which direction the boat is moving. In addition, this also gives us an indicator of the boat’s speed, depending on how fast the point is moving on the map.
To prevent the illuminated point from disappearing from our field of vision at some point, the chart is trailed so that our section always remains roughly the same in relation to the boat’s position. A chart plotter works in a very similar way.
Our digital map usually works vectorially, this means we can zoom in or out of the maps. Depending on which detailed information we need in the driving area. Each point (i.e., each position on the map) has an identifier that uniquely defines it. These are its coordinates.
On the globe, we take the longitude and latitude circles of the globe. Where a certain meridian intersects with a circle of latitude is our point or our current position on the map. The position information is provided by the GPS, the chart plotter determines in the second step where exactly these coordinates are located on the map and places a boat symbol there.
The position query runs 10 times per second on mid-range and higher GPS systems. As a result, boat movement on the map is very smooth and the displayed boat position is very close to the actual conditions. In addition, the system works even at slow boat speed to normal drifting when fishing.
-
The Ultimate Fish Finder Guide
Download 40 pages for free now
Reviews ( 17 )
- Rated 5 out of 5
Raphaël G
Very effective. - Rated 5 out of 5
Vladimir M
The book describes the fish finder physics and builds up your understanding of how it actually works. I have yet to apply this knowledge with my Humminbird, but having that much of theory is extremely helpful in understanding and processing the sonar output. - Rated 5 out of 5
NICHOLAS JOHN REECY
The Deeper Guide was just what I was looking for. YouTube is full of reviews of the sonar but little in the way of education. I highly recommend for those wanting to better understand their Deeper sonar. - Rated 5 out of 5
Henrik
I am a beginner when it comes to fishing with fish finders. For me, the book has been very informative to judge the displays on the fish finder "realistically" and to recognize what limits there are when searching for fish with the fish finder. Now I know when I have to use my regular sonar and when I have to use my ClearVü or which settings I should apply to the device at which spot. I was impressed by the many illustrations, especially for understanding the functions. - Rated 5 out of 5
Dr. Manfred Marx
Very well written, so that it is understandable even for amateurs and structured concisely. - Rated 5 out of 5
Andreas Witz
An excellent book for learning about fish finders. - Rated 5 out of 5
AK
The ultimate fish finder guide is a beneficial introduction. I am excited to put into practice what I have learned. - Rated 5 out of 5
Lübbe Wolfgang
A well-written problem solver. - Rated 5 out of 5
Kalksee
The book is unmatched for understanding how a sonar/fish finder works. I was a fish arch hunter, and I suspect my fishing tactics will change. The book has clear writing, and you understand you understand a lot the first time you read it. I can only recommend it to anyone interested in technology. Thank you for this fantastic book! Thoralf - Rated 5 out of 5
Enrico Indelicato
I had absolutely no idea about fish finders. Since I read the book, I had a real Aha experience! For me, as a beginner, very detailed and uncomplicated explained. I can only recommend it! Best regards Enrico - Rated 5 out of 5
Udo
Reading this book has suddenly made my fish finders much more valuable to me! I realized that I made typical mistakes in interpreting the images, which I will now avoid. The authors use clear, understandable language and also explain the mathematical-physical basics very well. The fact that there is no advertising for one or another fish finder manufacturer has increased its credibility. At the same time, you get a solid impression of what is feasible today on this subject - and the "advertisements" of the manufacturers also helped. The book is ABSOLUTELY to recommend, because what good is an expensive fish finder if you too often draw the wrong conclusions from the obtained illustrations? In this respect, the money for the book is very well invested. - Rated 5 out of 5
Josef Weiss
I had to wait a long time for such great explanations. Thank you. - Rated 5 out of 5
Peter
It is a well-described, scientifically sound book highly recommended to anyone who wants to advance and doesn't already know everything. - Rated 5 out of 5
Holger Just
Ich angle seit Jahren mit Echolot. Aber erstens bleibt man da irgendwann auf einer bestimmten Verständnisstufe stehen, diese konnte ich durch dieses Buch um einiges anheben. Als zweiten Aspekt mußte ich nach dem Lesen dieses Buches erkennen, dass ich durch "gefährliches Halbwissen" jahrelang Fehlinterpretationen hatte bzw. die Möglichkeiten meines Lotes nie richtig ausgenutzt habe. Also mein Fazit : Sehr empfehlenswert, die komplexen Zusammenhänge sind verständlich beschrieben. Das Buch ist ideal geeignet um sich in der angelfreien Zeit wertvolles Wissen für die folgende Saison anzueignen und beim Thema Echolot wieder uptodate zu sein. - Rated 5 out of 5
Matthias Wappler
Sehr gut!! - Rated 5 out of 5
M. Hermanns
Wer dieses Buch nicht liest, ist selber Schuld! Kein Vortrag, kein Presseartikel oder Bericht, Nein sogar keine Online-Schulung oder gar ein 365 Tage Support, vermittelt so viele essentielle Kenntnisse, wie dieses Buch. Nach zwei drei bebilderten Erklärungen wird dir klar, das ohne dieses Wissen, die Gewinn bringende Nutzung eines Echolotes gar nicht möglich ist. Beziehungsweise dir wird klar das du dein Echolot bisher sehr ineffizient genutzt hast und das dir eine Menge verborgen geblieben ist. Ich habe nach dem ersten gleich drei weitere Exemplare gekauft und drei guten Angelfreunden eine Anerkennung für unsere Freundschaft mit diesem Buch gemacht. Alle drei verfügen über 30 Jahre Bootsangelerfahrung und alle drei waren ebenfalls begeistert, jeder konnte sein Wissen deutlich erweitern. Deshalb freue ich mich auch so sehr auf das Zanderbuch welches hoffentlich noch vor dem Wochenende bei mir ist. Liebe Grüße weiter so. dermarc - Rated 5 out of 5
TACKLEFEVER
Das Buch beginnt mit rund 15 Seiten Technik Erläuterung bei der versierte Echolot Nutzer, zu denen ich mich zähle, vielleicht geneigt sind weiter zu blättern weil sie vieles schon wissen und Anfänger weiter blättern möchten weil es zu trocken scheint. Aber etwas Basiswissen gehört einfach dazu. Selbst wenn man als Anfänger bei der Basis Theorie weiter blättern will, sobald es um Chirp geht sollte "jeder" genauer hinschauen 😉 es lohnt sich. Und auch für mich fand ich noch ein zwei kleine Dinge die ich nicht wusste oder noch nicht im Zusammenhang mit anderem sah. Die weiteren Abschnitte (bis Kap. 3) befassen sich mit den verschiedenen Techniken der Geber, Bildschirme, oder dem Smartphone, dem Tablet als Anzeigemedium. Was mir bis dahin sehr positiv auffiel waren die "MERKE-Boxen", kleine übersichtliche Passagen welche Kerninformationen des zuvor vermittelten Wissen zusammenfassend hervorheben. Auch wenn man nicht alles komplett verstanden hat, hilft diese leicht verständliche Zusammenfassung des voraus gegangenen Inhalts sehr. Kapitel 4 geht auf 2D, Down-Imaging, Side-Scan-Sonar ein, dabei ohne zu konkret auf einen Hersteller abzustellen was ich ebenfalls sehr positiv fand. Dem Angler wird der praktische Einsatz und das Verstehen dessen was man auf dem Echolot sieht erläutert. Fragen wie z.B.: Wo befindet sich der Fisch genau? Was ist eine Fischsichel? Wie setze ich das Echolot beim Vertikalangeln ein? Warum gibt es Vertiefungen obwohl man keine sieht und umgekehrt? Wie erkenne ich die Bodenbeschaffenheit? Fragen zur richtigen Deutung der Unterwasserstruktur, dem optimalen Bildlauf- und Boots- Geschwindigkeit, der Sprungschicht, usw. werden auch beantwortet. Würde ich alles aufzählen würde es hier zu weit führen. Es folgen noch kurze Infos zur Multibeam Technik und ein Kapitel "Die 3D Show mit Garmins Panoptix". Hier wurde für mich zu wenig Wissen vermittelt, nur auf einen Herstellers gezeigt und nicht auf ähnliche Funktionen oder Techniken anderer Hersteller Bezug genommen. Ich hoffe es kommt in der nächsten Auflage mehr zu dem Thema. Am Ende des Buches kommen Infos rund um konkrete Einstellungen am Echolot. Hier wird einer der wichtigsten Punkte überhaupt behandelt und dies praxisnah und hilfreich. Aller spätestens jetzt lohnt sich das Buch für alle Neueinsteiger. Viel einfacher und kompakter geht es kaum. Ein paar wichtige zuvor besprochene Punkte zu Einstellungen bei bestimmten Echolot Funktionen werden erläutert und mit Checklisten im Kapitel "Die effektivsten Einstellungen beim Echolot auf einen Blick" zusammen gefasst. Hier lohnt es sich für Anfänger die Seiten besonders aufmerksam zu lesen und vielleicht als Kopie mit auf Boot zu nehmen. Damit fällt der Kampf mit den gefühlten tausenden von Einstellungen am Echolot auf dem Wasser leichter. Es klingt fast zu schön um wahr zu sein, aber tatsächlich scheint mir das Buch für Anfänger und Fortgeschrittene Anwender gleichermaßen gut geeignet zu sein. Manchmal suchte ich mehr Hintergrundwissen, weil der im Prinzip sehr gute Ansatz es für Anfänger leicht verständlich zu halten manche Herstellerabhängige Feinheiten außer Acht lässt. Das Buch hat eine gute Gliederung, fasst vieles kompakt zusammen und geht bei wichtigen Punkten auch meist für Fortgeschrittene etwas in die Tiefe. So richtet sich das Buch meiner Meinung nach nicht an wissenschaftliche Anwender, sondern an Echolot Neulinge indem es auch viele Basis Fragen beantwortet ebenso auch an Fortgeschrittene indem es auf diverse Punkte tiefer eingeht. Wenn ich den Sinn des Buches in einem Satz beschreiben sollte, dann wäre dies: Echolottechnik für Anfänger interessant und verständlich erklären und dabei auch ein wenig tieferes Wissen für alle zu vermitteln. Mir ist Stand Juni 2017 kein anderes Buch bekannt das diesen Ansatz so konsequent verfolgt. Ich hoffe ihr habt so viel Spaß beim lesen wie ich. Luke www.tacklefever.de
6. How to navigate the lake with the chartplotter?
Well, we have seen so far that something happens on the displayed nautical chart after the plotter is turned on. The boat symbol appears at the current position and continues to move on the chart. So the direction of travel and the progress of the boat are easy to follow. We know all this from our navigation system in the car. With this, the map display runs very similarly, without anything being entered. We can continue the comparison, because there are some parallels.
Let’s start with the destination input: Here, you can either enter the destination address in the form of coordinates on the chart plotter. Or you can mark the location on the map itself via the touchscreen or the cursor in the case of keyboard operation.
The chart plotter then creates trackpoints that it can save and recall. Waypoints can be connected to a route, which is comparable to a start-finish route on a car navigation system. Including a number of intermediate destinations that lie on the route.
If you travel such a route with the boat, the chart plotter lays down a travel track on the screen – the so-called tracks. These contain all maneuvers with all deviations from the rod itself. These tracks can be saved and recalled on another occasion.
Tip: All tracks are recorded and also displayed in the default setting. This means that more and more track traces become visible on the map. From time to time, however, you have to delete them on the screen, because otherwise they cover the map. You can’t believe how many fish finder owners are super annoyed because they can’t see anything on the map at some point.
The tracks are also important from a safety point of view on the water. When the fog suddenly sets in and visibility is poor – which sometimes happens very quickly, within just a quarter of an hour – the tracks are the only way to orient yourself on the water.
You simply reverse the previously recorded track and drive it back. With careful driving, as well as a “lookout” at the bow, the “backtracking” to the safe harbor should succeed.
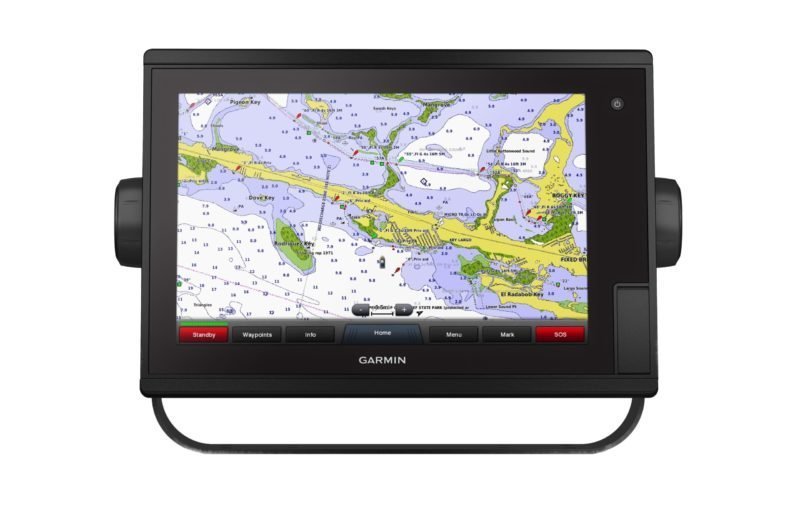
Navigation to a waypoint or on a desired route is started with the command “Navigate to”. The chartplotter then shows the route from the start to the destination point with a strong line (e.g. magenta on Garmin fish finders and chartplotters ), which indicates the direct course to the destination point. In the middle of this line is another thin line (e.g. purple on Garmin) indicating the corrected course.
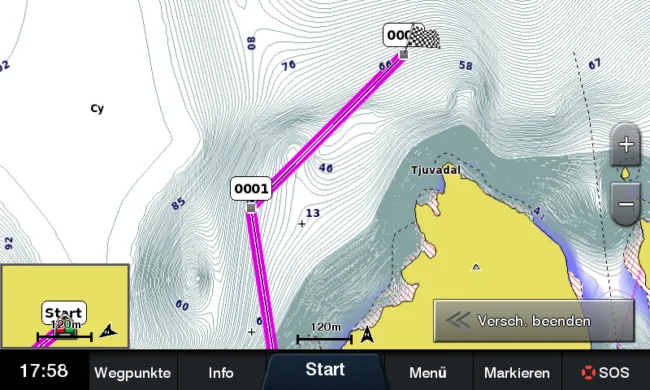
This line is dynamic –that means it shifts as soon as there is a deviation from the direct course – and thus indicates the course to be followed at the moment. Of course, you can also return directly to the original course (magenta line) and/or use the orange heading arrow as a tool for a course correction.
All common chart formats also offer “autorouting”, which calculates a safe suggested route based on current boat and water data. An autopilot would follow this course suggestion.
But the same applies here – as with all suggested courses, by the way: The decision and last instance in the responsibility for boat and crew lies with the skipper. He decides whether or not to follow the guidelines.
7. How important are good charts for the chartplotter?
A chartplotter without maps is like a computer without software. This answers the question posed at the beginning of this article in a nutshell. Nevertheless, there are still many users among us who first buy an expensive combination device, but subsequently do without suitable sea charts – because they cost money. We always recommend to such users to remove the charts from their car navigator and to navigate on a white background. Or even better, use a LiveMapping, which gradually creates its own road maps.
To this must be added that cars drive on roads that can be followed. On the water, there are no marked paths. We don’t even want to talk about extreme situations – such as orientation in fog.
An example to illustrate:
Sea charts are therefore an indispensable purchase for us as soon as we are on the move on larger waters. In saltwater areas, they should be part of the mandatory equipment of a boat angler, everything else is negligent.
Anyone who does not want to follow this postulate should take a look at the functions of a plotter that are left unused and only run with existing charts. And what opportunities they miss to find hotspots on the map and thus catch more fish, we will show in the following two examples.
-
The Ultimate Fish Finder Guide
Download 40 pages for free now
Reviews ( 17 )
- Rated 5 out of 5
Raphaël G
Very effective. - Rated 5 out of 5
Vladimir M
The book describes the fish finder physics and builds up your understanding of how it actually works. I have yet to apply this knowledge with my Humminbird, but having that much of theory is extremely helpful in understanding and processing the sonar output. - Rated 5 out of 5
NICHOLAS JOHN REECY
The Deeper Guide was just what I was looking for. YouTube is full of reviews of the sonar but little in the way of education. I highly recommend for those wanting to better understand their Deeper sonar. - Rated 5 out of 5
Henrik
I am a beginner when it comes to fishing with fish finders. For me, the book has been very informative to judge the displays on the fish finder "realistically" and to recognize what limits there are when searching for fish with the fish finder. Now I know when I have to use my regular sonar and when I have to use my ClearVü or which settings I should apply to the device at which spot. I was impressed by the many illustrations, especially for understanding the functions. - Rated 5 out of 5
Dr. Manfred Marx
Very well written, so that it is understandable even for amateurs and structured concisely. - Rated 5 out of 5
Andreas Witz
An excellent book for learning about fish finders. - Rated 5 out of 5
AK
The ultimate fish finder guide is a beneficial introduction. I am excited to put into practice what I have learned. - Rated 5 out of 5
Lübbe Wolfgang
A well-written problem solver. - Rated 5 out of 5
Kalksee
The book is unmatched for understanding how a sonar/fish finder works. I was a fish arch hunter, and I suspect my fishing tactics will change. The book has clear writing, and you understand you understand a lot the first time you read it. I can only recommend it to anyone interested in technology. Thank you for this fantastic book! Thoralf - Rated 5 out of 5
Enrico Indelicato
I had absolutely no idea about fish finders. Since I read the book, I had a real Aha experience! For me, as a beginner, very detailed and uncomplicated explained. I can only recommend it! Best regards Enrico - Rated 5 out of 5
Udo
Reading this book has suddenly made my fish finders much more valuable to me! I realized that I made typical mistakes in interpreting the images, which I will now avoid. The authors use clear, understandable language and also explain the mathematical-physical basics very well. The fact that there is no advertising for one or another fish finder manufacturer has increased its credibility. At the same time, you get a solid impression of what is feasible today on this subject - and the "advertisements" of the manufacturers also helped. The book is ABSOLUTELY to recommend, because what good is an expensive fish finder if you too often draw the wrong conclusions from the obtained illustrations? In this respect, the money for the book is very well invested. - Rated 5 out of 5
Josef Weiss
I had to wait a long time for such great explanations. Thank you. - Rated 5 out of 5
Peter
It is a well-described, scientifically sound book highly recommended to anyone who wants to advance and doesn't already know everything. - Rated 5 out of 5
Holger Just
Ich angle seit Jahren mit Echolot. Aber erstens bleibt man da irgendwann auf einer bestimmten Verständnisstufe stehen, diese konnte ich durch dieses Buch um einiges anheben. Als zweiten Aspekt mußte ich nach dem Lesen dieses Buches erkennen, dass ich durch "gefährliches Halbwissen" jahrelang Fehlinterpretationen hatte bzw. die Möglichkeiten meines Lotes nie richtig ausgenutzt habe. Also mein Fazit : Sehr empfehlenswert, die komplexen Zusammenhänge sind verständlich beschrieben. Das Buch ist ideal geeignet um sich in der angelfreien Zeit wertvolles Wissen für die folgende Saison anzueignen und beim Thema Echolot wieder uptodate zu sein. - Rated 5 out of 5
Matthias Wappler
Sehr gut!! - Rated 5 out of 5
M. Hermanns
Wer dieses Buch nicht liest, ist selber Schuld! Kein Vortrag, kein Presseartikel oder Bericht, Nein sogar keine Online-Schulung oder gar ein 365 Tage Support, vermittelt so viele essentielle Kenntnisse, wie dieses Buch. Nach zwei drei bebilderten Erklärungen wird dir klar, das ohne dieses Wissen, die Gewinn bringende Nutzung eines Echolotes gar nicht möglich ist. Beziehungsweise dir wird klar das du dein Echolot bisher sehr ineffizient genutzt hast und das dir eine Menge verborgen geblieben ist. Ich habe nach dem ersten gleich drei weitere Exemplare gekauft und drei guten Angelfreunden eine Anerkennung für unsere Freundschaft mit diesem Buch gemacht. Alle drei verfügen über 30 Jahre Bootsangelerfahrung und alle drei waren ebenfalls begeistert, jeder konnte sein Wissen deutlich erweitern. Deshalb freue ich mich auch so sehr auf das Zanderbuch welches hoffentlich noch vor dem Wochenende bei mir ist. Liebe Grüße weiter so. dermarc - Rated 5 out of 5
TACKLEFEVER
Das Buch beginnt mit rund 15 Seiten Technik Erläuterung bei der versierte Echolot Nutzer, zu denen ich mich zähle, vielleicht geneigt sind weiter zu blättern weil sie vieles schon wissen und Anfänger weiter blättern möchten weil es zu trocken scheint. Aber etwas Basiswissen gehört einfach dazu. Selbst wenn man als Anfänger bei der Basis Theorie weiter blättern will, sobald es um Chirp geht sollte "jeder" genauer hinschauen 😉 es lohnt sich. Und auch für mich fand ich noch ein zwei kleine Dinge die ich nicht wusste oder noch nicht im Zusammenhang mit anderem sah. Die weiteren Abschnitte (bis Kap. 3) befassen sich mit den verschiedenen Techniken der Geber, Bildschirme, oder dem Smartphone, dem Tablet als Anzeigemedium. Was mir bis dahin sehr positiv auffiel waren die "MERKE-Boxen", kleine übersichtliche Passagen welche Kerninformationen des zuvor vermittelten Wissen zusammenfassend hervorheben. Auch wenn man nicht alles komplett verstanden hat, hilft diese leicht verständliche Zusammenfassung des voraus gegangenen Inhalts sehr. Kapitel 4 geht auf 2D, Down-Imaging, Side-Scan-Sonar ein, dabei ohne zu konkret auf einen Hersteller abzustellen was ich ebenfalls sehr positiv fand. Dem Angler wird der praktische Einsatz und das Verstehen dessen was man auf dem Echolot sieht erläutert. Fragen wie z.B.: Wo befindet sich der Fisch genau? Was ist eine Fischsichel? Wie setze ich das Echolot beim Vertikalangeln ein? Warum gibt es Vertiefungen obwohl man keine sieht und umgekehrt? Wie erkenne ich die Bodenbeschaffenheit? Fragen zur richtigen Deutung der Unterwasserstruktur, dem optimalen Bildlauf- und Boots- Geschwindigkeit, der Sprungschicht, usw. werden auch beantwortet. Würde ich alles aufzählen würde es hier zu weit führen. Es folgen noch kurze Infos zur Multibeam Technik und ein Kapitel "Die 3D Show mit Garmins Panoptix". Hier wurde für mich zu wenig Wissen vermittelt, nur auf einen Herstellers gezeigt und nicht auf ähnliche Funktionen oder Techniken anderer Hersteller Bezug genommen. Ich hoffe es kommt in der nächsten Auflage mehr zu dem Thema. Am Ende des Buches kommen Infos rund um konkrete Einstellungen am Echolot. Hier wird einer der wichtigsten Punkte überhaupt behandelt und dies praxisnah und hilfreich. Aller spätestens jetzt lohnt sich das Buch für alle Neueinsteiger. Viel einfacher und kompakter geht es kaum. Ein paar wichtige zuvor besprochene Punkte zu Einstellungen bei bestimmten Echolot Funktionen werden erläutert und mit Checklisten im Kapitel "Die effektivsten Einstellungen beim Echolot auf einen Blick" zusammen gefasst. Hier lohnt es sich für Anfänger die Seiten besonders aufmerksam zu lesen und vielleicht als Kopie mit auf Boot zu nehmen. Damit fällt der Kampf mit den gefühlten tausenden von Einstellungen am Echolot auf dem Wasser leichter. Es klingt fast zu schön um wahr zu sein, aber tatsächlich scheint mir das Buch für Anfänger und Fortgeschrittene Anwender gleichermaßen gut geeignet zu sein. Manchmal suchte ich mehr Hintergrundwissen, weil der im Prinzip sehr gute Ansatz es für Anfänger leicht verständlich zu halten manche Herstellerabhängige Feinheiten außer Acht lässt. Das Buch hat eine gute Gliederung, fasst vieles kompakt zusammen und geht bei wichtigen Punkten auch meist für Fortgeschrittene etwas in die Tiefe. So richtet sich das Buch meiner Meinung nach nicht an wissenschaftliche Anwender, sondern an Echolot Neulinge indem es auch viele Basis Fragen beantwortet ebenso auch an Fortgeschrittene indem es auf diverse Punkte tiefer eingeht. Wenn ich den Sinn des Buches in einem Satz beschreiben sollte, dann wäre dies: Echolottechnik für Anfänger interessant und verständlich erklären und dabei auch ein wenig tieferes Wissen für alle zu vermitteln. Mir ist Stand Juni 2017 kein anderes Buch bekannt das diesen Ansatz so konsequent verfolgt. Ich hoffe ihr habt so viel Spaß beim lesen wie ich. Luke www.tacklefever.de
8. What are the advantages of the chart plotter for us anglers besides navigation? (Examples from practice)
We want to illustrate the use and possibilities of a plotter with two model examples to show the advantages of using one for fishing with fish finders.
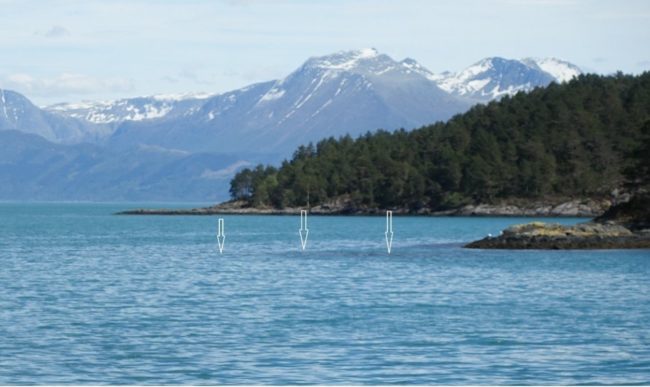
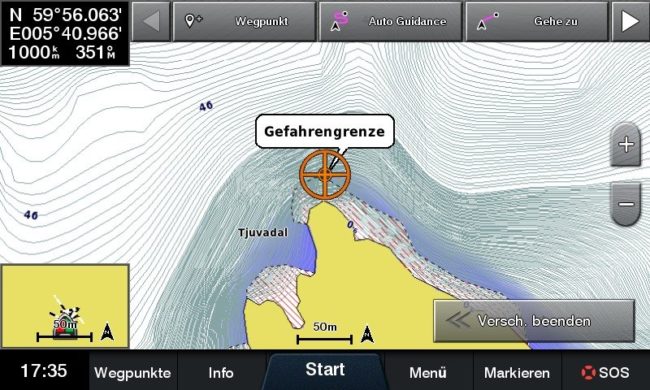
8.1 Chart plotter in saltwater fishing
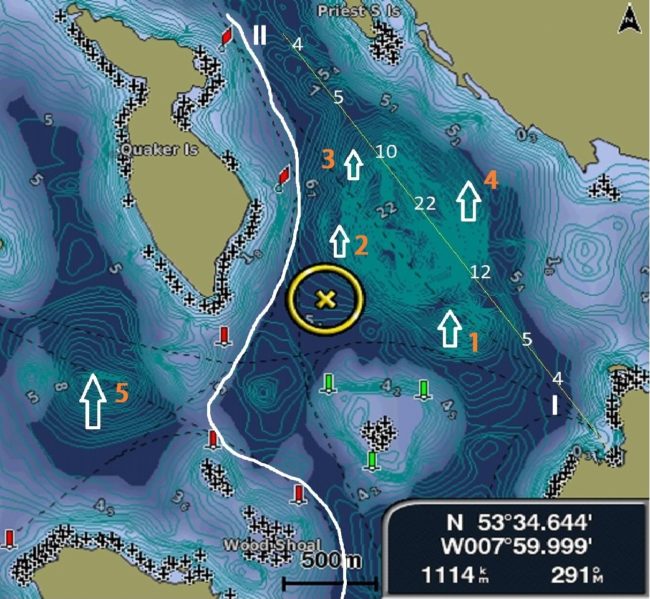
As a fishing area we have chosen a fjord section of Hardanger near Onarheim. It is our first time at this water and we want to quickly find the hotspots and of course fish successfully.
Preparation:
Find possible hotspots on the map, examine them in detail and set waypoints.
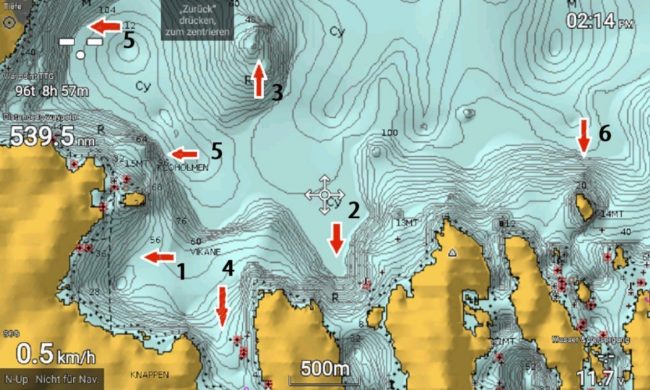
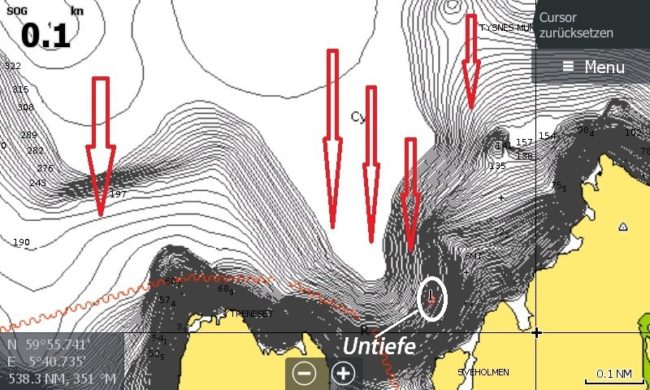
Determine drift directions in rising water and plan drift passages:
Here at an example Hotspot No. 2 exemplary listed. If you want to be precise, you can provide the individual drift passages at the start with a waypoint, then this particular drift can be repeated at any time.
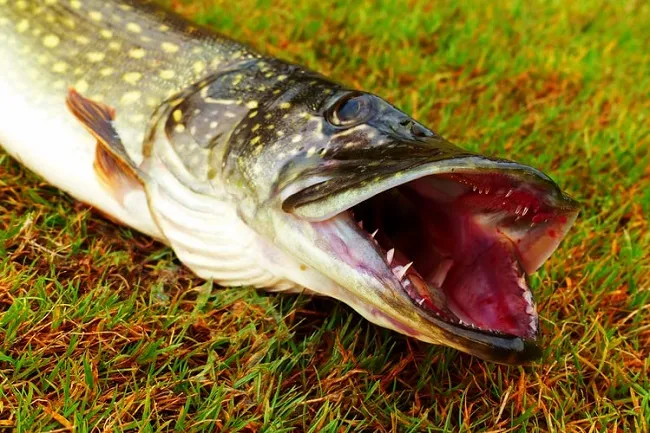
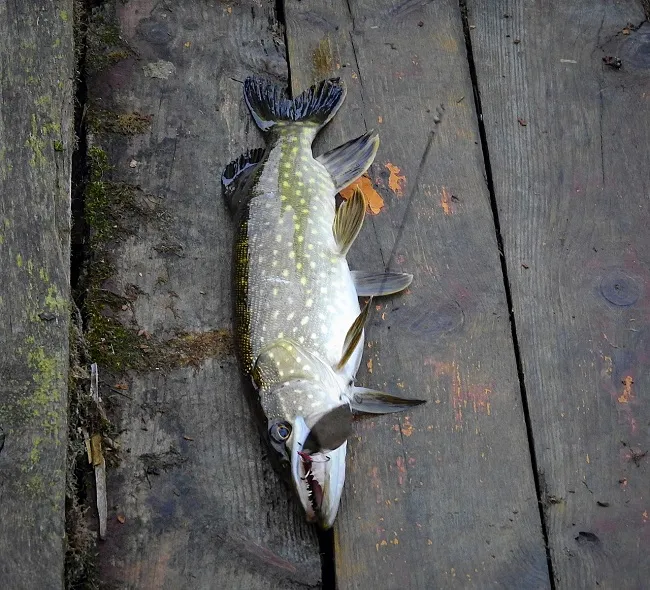
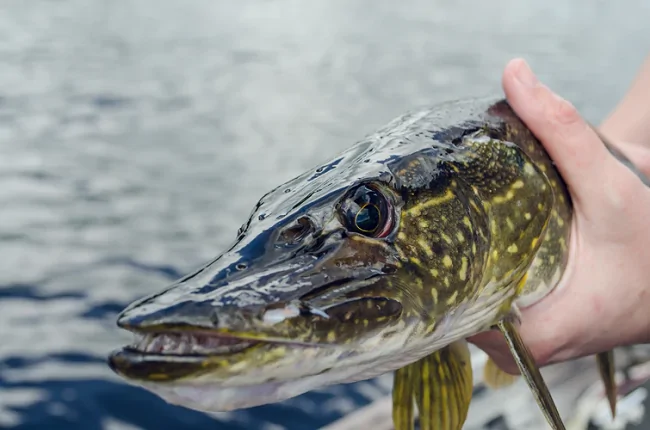
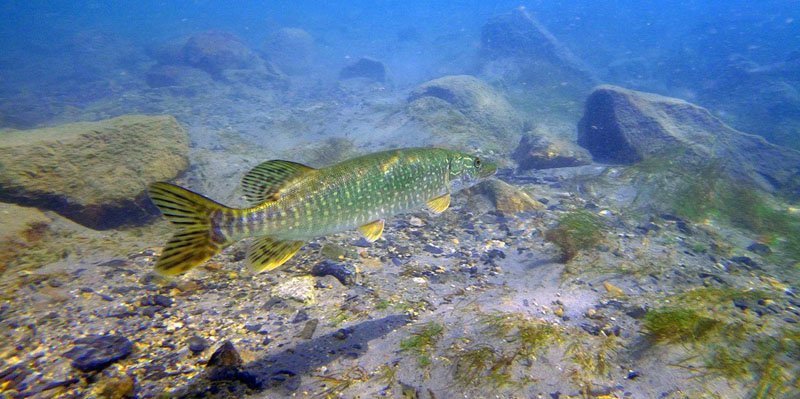
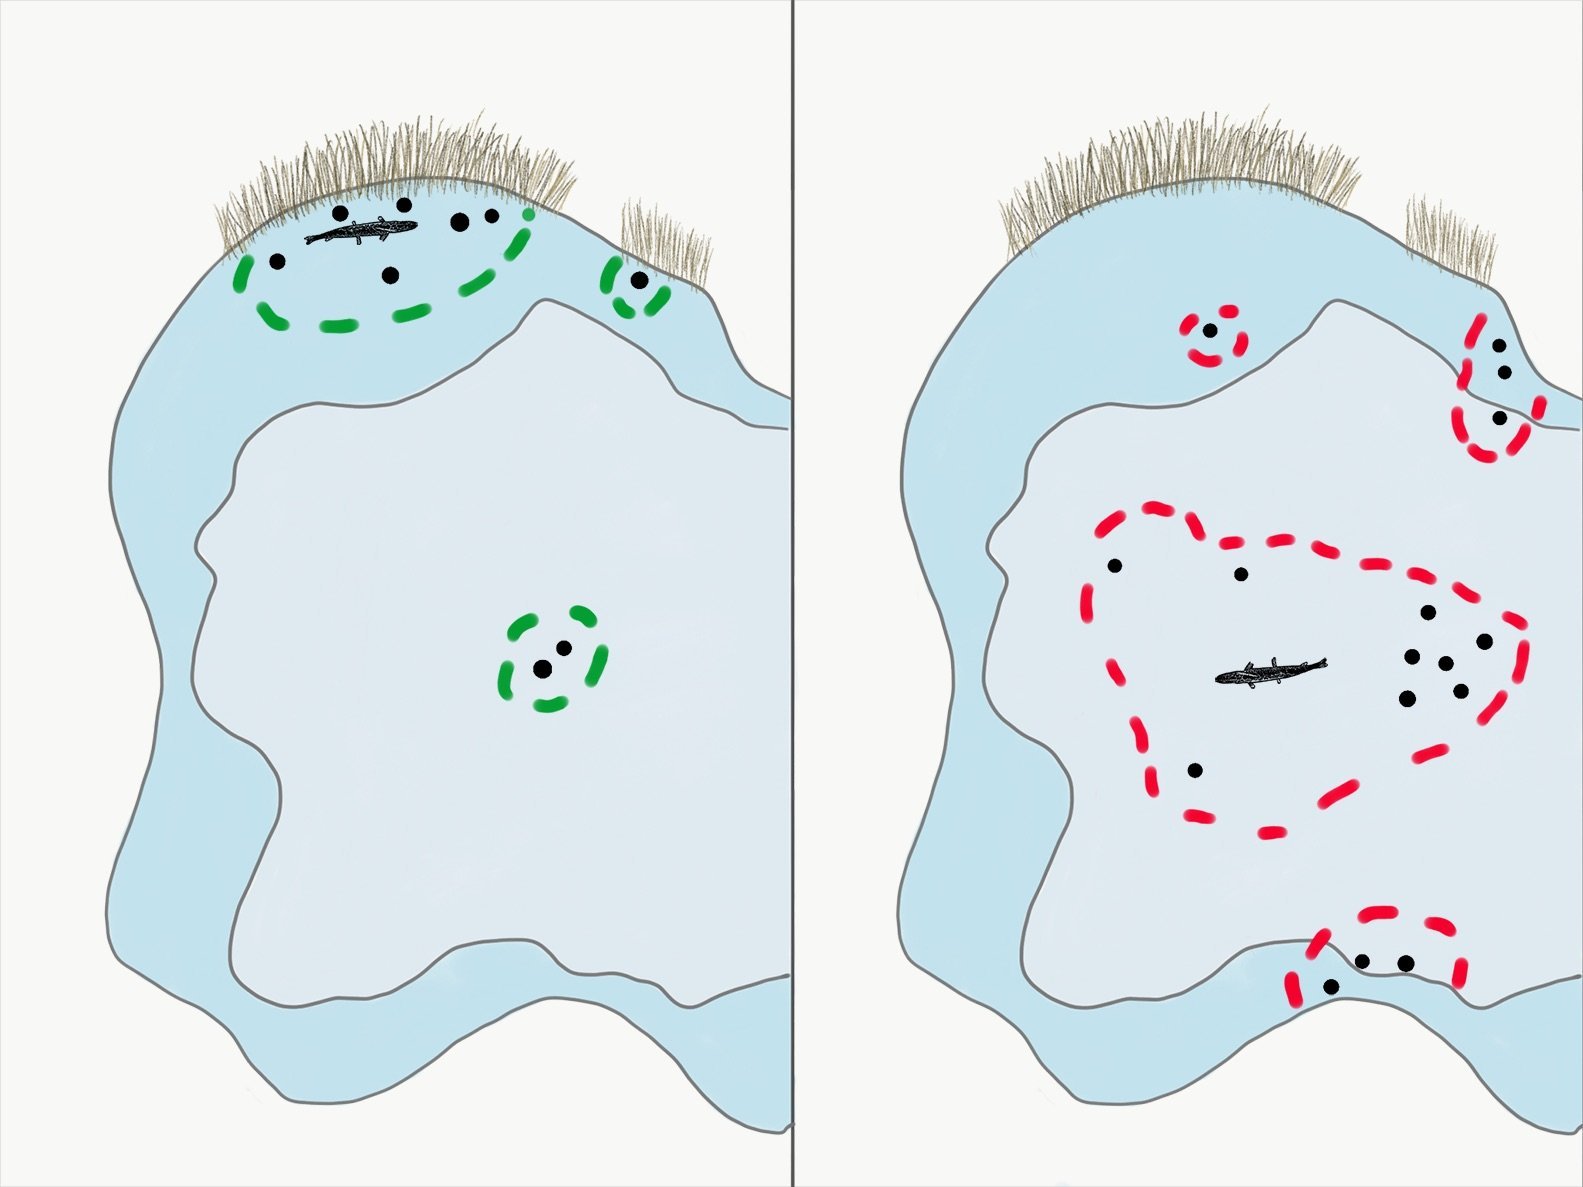
8.2 Freshwater fishing for pike
As an example, we have chosen one of the great Shannon Lakes in Ireland. Lough Ree is very popular with pike fishermen due to its excellent fish population. Structurally, there are similarities with its Mecklenburg relatives – at least as far as depth geometry is concerned.
The screenshot (Garmin Bluechart G2) shows a section of water in the north near the mouth of the river Inny. How promising the work with plotter and map is can be seen directly from the present map section.
Also worth reading: In 10 minutes to the pike
9. Which charts are recommended for chartplotters?
On the whole, three chart providers are interesting for our European region. Which one is shortlisted for a specific acquisition project depends first of all on the respective chart plotter model.
If, for example, you have chosen a device from Garmin, only the charts from the same manufacturer (the Bluechart G2/G3 charts) come into question. All others are not compatible.
The remaining two chart providers, Navionics and C-Map, then serve all other manufacturers from Lowrance and Humminbird to Simrad and Raymarine.
As far as Navionics is concerned, the division was bought by Garmin, but nothing has changed in terms of device compatibility. At the moment, it can only be observed that there is a lively exchange of data between Garmin and Navionics and that the map offering is being shifted to Navionics.
If you want to take a closer look at this question, we recommend our upcoming article on the topic of nautical charts. For us, the main focus of chart use, if not with Garmin, then with the Navionics offerings.
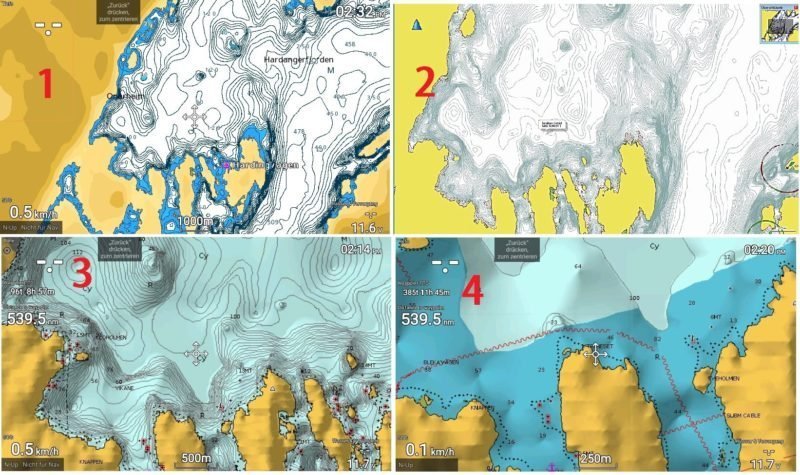
Why is quickly explained: Besides the Garmin Bluechart G2 charts, the Navionics+ and Navionics Platinum+ charts provide the best bathymetric representations for us anglers.
With high-resolution depth contours and large zoom ranges, they are the best tool for exploring a body of water and conducting successful fishing trips. The following illustrations make the advantages and disadvantages of the different fishing maps clear at a glance.
10. Why live mapping is a useful chartplotter addition?
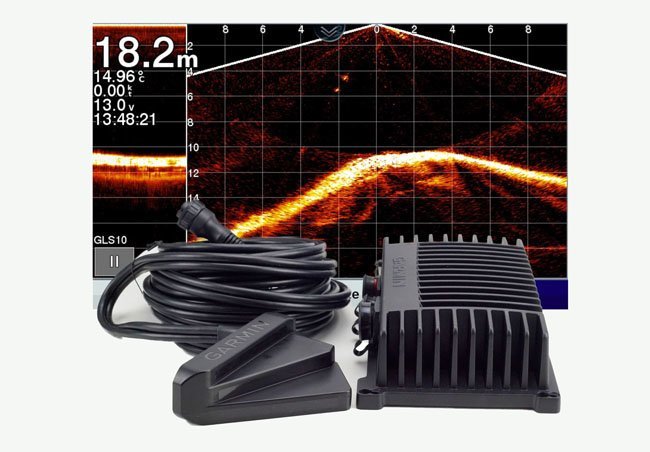
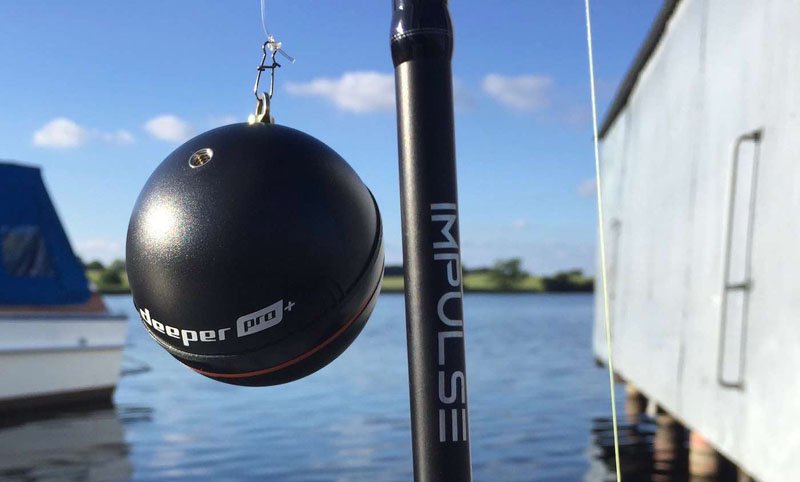
In order to create your own waterway maps, two tools are required as minimum equipment.
A GPS system to set the coordinates,
and an sonar module to sound the depth and record the depth contours.
The map recording – or as it is so nicely called the mapping – always takes place live in the area that is just passed through by the boat as well as recorded by the fish finder. Thus, a complete record of the current water can be created gradually. The common combination devices from different manufacturers all have live mapping functions.
At Garmin it is called “Quick Draw Contours”,
at Lowrance and Simrad works the “C-Map Genesis Live”,
Raymarine calls its system “RealBathy” and
Humminbird is mapped via “AutoChart LIve”.
If one has now decided on a particular fish finder manufacturer, only the respective system supported by the manufacturer is available. With the live mapping functions, the possibilities of the plotter in conjunction with the purchasable nautical charts are also extended to waters that were previously without a map offer. This applies to all virgin fishing grounds.
However, established fishing grounds also benefit from this recording method. For example, Navionics offers the possibility via “SonarChartLive” to subsequently revise the existing charts and insert them into the existing charts. This means that the plotter can in principle be used profitably in all types of waters.
-
The Ultimate Fish Finder Guide
Download 40 pages for free now
Reviews ( 17 )
- Rated 5 out of 5
Raphaël G
Very effective. - Rated 5 out of 5
Vladimir M
The book describes the fish finder physics and builds up your understanding of how it actually works. I have yet to apply this knowledge with my Humminbird, but having that much of theory is extremely helpful in understanding and processing the sonar output. - Rated 5 out of 5
NICHOLAS JOHN REECY
The Deeper Guide was just what I was looking for. YouTube is full of reviews of the sonar but little in the way of education. I highly recommend for those wanting to better understand their Deeper sonar. - Rated 5 out of 5
Henrik
I am a beginner when it comes to fishing with fish finders. For me, the book has been very informative to judge the displays on the fish finder "realistically" and to recognize what limits there are when searching for fish with the fish finder. Now I know when I have to use my regular sonar and when I have to use my ClearVü or which settings I should apply to the device at which spot. I was impressed by the many illustrations, especially for understanding the functions. - Rated 5 out of 5
Dr. Manfred Marx
Very well written, so that it is understandable even for amateurs and structured concisely. - Rated 5 out of 5
Andreas Witz
An excellent book for learning about fish finders. - Rated 5 out of 5
AK
The ultimate fish finder guide is a beneficial introduction. I am excited to put into practice what I have learned. - Rated 5 out of 5
Lübbe Wolfgang
A well-written problem solver. - Rated 5 out of 5
Kalksee
The book is unmatched for understanding how a sonar/fish finder works. I was a fish arch hunter, and I suspect my fishing tactics will change. The book has clear writing, and you understand you understand a lot the first time you read it. I can only recommend it to anyone interested in technology. Thank you for this fantastic book! Thoralf - Rated 5 out of 5
Enrico Indelicato
I had absolutely no idea about fish finders. Since I read the book, I had a real Aha experience! For me, as a beginner, very detailed and uncomplicated explained. I can only recommend it! Best regards Enrico - Rated 5 out of 5
Udo
Reading this book has suddenly made my fish finders much more valuable to me! I realized that I made typical mistakes in interpreting the images, which I will now avoid. The authors use clear, understandable language and also explain the mathematical-physical basics very well. The fact that there is no advertising for one or another fish finder manufacturer has increased its credibility. At the same time, you get a solid impression of what is feasible today on this subject - and the "advertisements" of the manufacturers also helped. The book is ABSOLUTELY to recommend, because what good is an expensive fish finder if you too often draw the wrong conclusions from the obtained illustrations? In this respect, the money for the book is very well invested. - Rated 5 out of 5
Josef Weiss
I had to wait a long time for such great explanations. Thank you. - Rated 5 out of 5
Peter
It is a well-described, scientifically sound book highly recommended to anyone who wants to advance and doesn't already know everything. - Rated 5 out of 5
Holger Just
Ich angle seit Jahren mit Echolot. Aber erstens bleibt man da irgendwann auf einer bestimmten Verständnisstufe stehen, diese konnte ich durch dieses Buch um einiges anheben. Als zweiten Aspekt mußte ich nach dem Lesen dieses Buches erkennen, dass ich durch "gefährliches Halbwissen" jahrelang Fehlinterpretationen hatte bzw. die Möglichkeiten meines Lotes nie richtig ausgenutzt habe. Also mein Fazit : Sehr empfehlenswert, die komplexen Zusammenhänge sind verständlich beschrieben. Das Buch ist ideal geeignet um sich in der angelfreien Zeit wertvolles Wissen für die folgende Saison anzueignen und beim Thema Echolot wieder uptodate zu sein. - Rated 5 out of 5
Matthias Wappler
Sehr gut!! - Rated 5 out of 5
M. Hermanns
Wer dieses Buch nicht liest, ist selber Schuld! Kein Vortrag, kein Presseartikel oder Bericht, Nein sogar keine Online-Schulung oder gar ein 365 Tage Support, vermittelt so viele essentielle Kenntnisse, wie dieses Buch. Nach zwei drei bebilderten Erklärungen wird dir klar, das ohne dieses Wissen, die Gewinn bringende Nutzung eines Echolotes gar nicht möglich ist. Beziehungsweise dir wird klar das du dein Echolot bisher sehr ineffizient genutzt hast und das dir eine Menge verborgen geblieben ist. Ich habe nach dem ersten gleich drei weitere Exemplare gekauft und drei guten Angelfreunden eine Anerkennung für unsere Freundschaft mit diesem Buch gemacht. Alle drei verfügen über 30 Jahre Bootsangelerfahrung und alle drei waren ebenfalls begeistert, jeder konnte sein Wissen deutlich erweitern. Deshalb freue ich mich auch so sehr auf das Zanderbuch welches hoffentlich noch vor dem Wochenende bei mir ist. Liebe Grüße weiter so. dermarc - Rated 5 out of 5
TACKLEFEVER
Das Buch beginnt mit rund 15 Seiten Technik Erläuterung bei der versierte Echolot Nutzer, zu denen ich mich zähle, vielleicht geneigt sind weiter zu blättern weil sie vieles schon wissen und Anfänger weiter blättern möchten weil es zu trocken scheint. Aber etwas Basiswissen gehört einfach dazu. Selbst wenn man als Anfänger bei der Basis Theorie weiter blättern will, sobald es um Chirp geht sollte "jeder" genauer hinschauen 😉 es lohnt sich. Und auch für mich fand ich noch ein zwei kleine Dinge die ich nicht wusste oder noch nicht im Zusammenhang mit anderem sah. Die weiteren Abschnitte (bis Kap. 3) befassen sich mit den verschiedenen Techniken der Geber, Bildschirme, oder dem Smartphone, dem Tablet als Anzeigemedium. Was mir bis dahin sehr positiv auffiel waren die "MERKE-Boxen", kleine übersichtliche Passagen welche Kerninformationen des zuvor vermittelten Wissen zusammenfassend hervorheben. Auch wenn man nicht alles komplett verstanden hat, hilft diese leicht verständliche Zusammenfassung des voraus gegangenen Inhalts sehr. Kapitel 4 geht auf 2D, Down-Imaging, Side-Scan-Sonar ein, dabei ohne zu konkret auf einen Hersteller abzustellen was ich ebenfalls sehr positiv fand. Dem Angler wird der praktische Einsatz und das Verstehen dessen was man auf dem Echolot sieht erläutert. Fragen wie z.B.: Wo befindet sich der Fisch genau? Was ist eine Fischsichel? Wie setze ich das Echolot beim Vertikalangeln ein? Warum gibt es Vertiefungen obwohl man keine sieht und umgekehrt? Wie erkenne ich die Bodenbeschaffenheit? Fragen zur richtigen Deutung der Unterwasserstruktur, dem optimalen Bildlauf- und Boots- Geschwindigkeit, der Sprungschicht, usw. werden auch beantwortet. Würde ich alles aufzählen würde es hier zu weit führen. Es folgen noch kurze Infos zur Multibeam Technik und ein Kapitel "Die 3D Show mit Garmins Panoptix". Hier wurde für mich zu wenig Wissen vermittelt, nur auf einen Herstellers gezeigt und nicht auf ähnliche Funktionen oder Techniken anderer Hersteller Bezug genommen. Ich hoffe es kommt in der nächsten Auflage mehr zu dem Thema. Am Ende des Buches kommen Infos rund um konkrete Einstellungen am Echolot. Hier wird einer der wichtigsten Punkte überhaupt behandelt und dies praxisnah und hilfreich. Aller spätestens jetzt lohnt sich das Buch für alle Neueinsteiger. Viel einfacher und kompakter geht es kaum. Ein paar wichtige zuvor besprochene Punkte zu Einstellungen bei bestimmten Echolot Funktionen werden erläutert und mit Checklisten im Kapitel "Die effektivsten Einstellungen beim Echolot auf einen Blick" zusammen gefasst. Hier lohnt es sich für Anfänger die Seiten besonders aufmerksam zu lesen und vielleicht als Kopie mit auf Boot zu nehmen. Damit fällt der Kampf mit den gefühlten tausenden von Einstellungen am Echolot auf dem Wasser leichter. Es klingt fast zu schön um wahr zu sein, aber tatsächlich scheint mir das Buch für Anfänger und Fortgeschrittene Anwender gleichermaßen gut geeignet zu sein. Manchmal suchte ich mehr Hintergrundwissen, weil der im Prinzip sehr gute Ansatz es für Anfänger leicht verständlich zu halten manche Herstellerabhängige Feinheiten außer Acht lässt. Das Buch hat eine gute Gliederung, fasst vieles kompakt zusammen und geht bei wichtigen Punkten auch meist für Fortgeschrittene etwas in die Tiefe. So richtet sich das Buch meiner Meinung nach nicht an wissenschaftliche Anwender, sondern an Echolot Neulinge indem es auch viele Basis Fragen beantwortet ebenso auch an Fortgeschrittene indem es auf diverse Punkte tiefer eingeht. Wenn ich den Sinn des Buches in einem Satz beschreiben sollte, dann wäre dies: Echolottechnik für Anfänger interessant und verständlich erklären und dabei auch ein wenig tieferes Wissen für alle zu vermitteln. Mir ist Stand Juni 2017 kein anderes Buch bekannt das diesen Ansatz so konsequent verfolgt. Ich hoffe ihr habt so viel Spaß beim lesen wie ich. Luke www.tacklefever.de
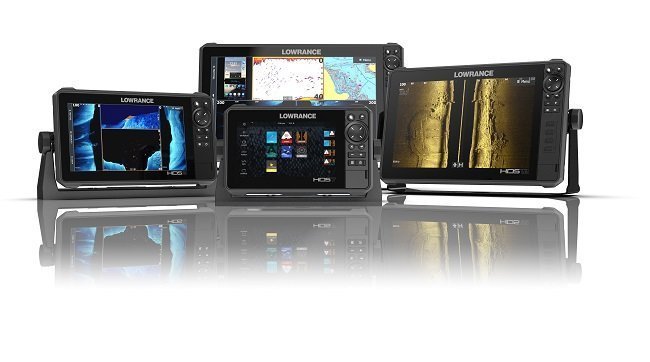
11. Which is the best chartplotter? Test with device recommendations!
If you are looking for a chart plotter and want to use an existing depth sounder, you have several options. In advance, it should be noted that the screen size should not fall below the 7-inch mark, if possible. On smaller screens, details in the water formation that indicate hotspots can easily be overlooked.
The following overview of recommendable solutions is graded according to the purchase price, which is calculated from
-
the device price
-
plus the expenses for the nautical charts
-
and any necessary accessories
is composed of. Note: The prices we quoted were current at the time of publication of this article – in the meantime they are probably somewhat lower (or in individual cases higher) than the values quoted here.
It should be noted that most models with comparable equipment and performance are available in all common screen sizes. That means: If you have found a suitable device in the 7-inch class, you will also find one in 9 and 12 inches with the same sample.
11.1 Chartplotter with sonar module
In individual cases, chart plotters are also available as plotter-only devices. As a rule, however, they are purchased as a combination device with a more or less extensively equipped sonar. In case of doubt, you will also take the combination offer, because the price difference to the pure chart plotter is rather small. The prices for chartplotter combos start in 7 inch at around 500 €. In this the sonar transducers are mostly already included. For 10-inch models, however, you’re looking at €2000 and more. This does not include the cost of the required sea charts.
a) Inexpensive 7-inch combo devices (< 700 €)
In this chapter you will find our recommendations for chartplotter combos for under 700€, starting with the
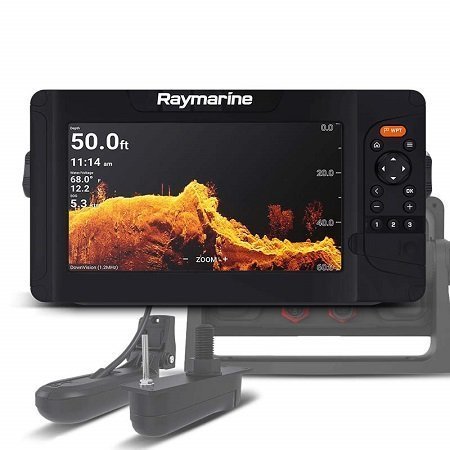
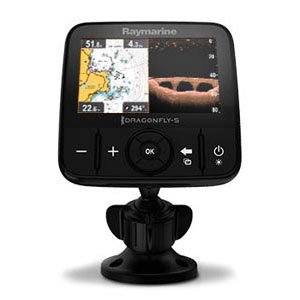
Raymarine Dragonfly 7 pro
The Raymarine Dragonfly 7 is already a true classic with
- Dual Chirp,
- DownScan
- and a properly equipped chart plotter,
- which, in combination with Navionics marine charts, meets the requirements of marine navigation.
As with the Hook Reveal, access is via the keyboard, whereby the joystick in the center has a central function. In terms of hardware, the Dragonfly is sufficiently equipped – waiting times are to be expected during map build and zoom-in, but they remain within typical behaviors of this price range. This Raymarine fish finder would work wonderfully with the Apple iPad chartplotter solution shown below for live mapping via the Boating app, so you could combine a great chirp sonar with a 10-inch chartplotter.
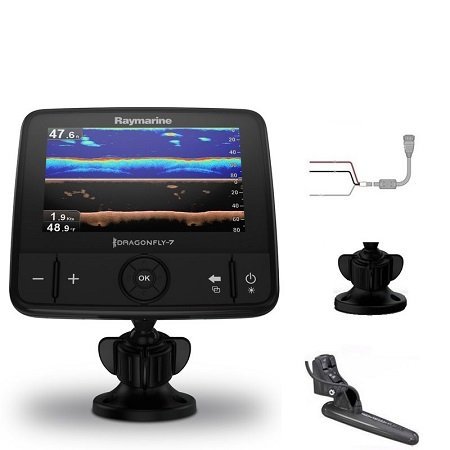
- Price: 529,00 €
- Suitable nautical charts: Navionics+ small
- Price: 133,50 €
- Total cost: 529,00 + 133,50 = 662,50 €
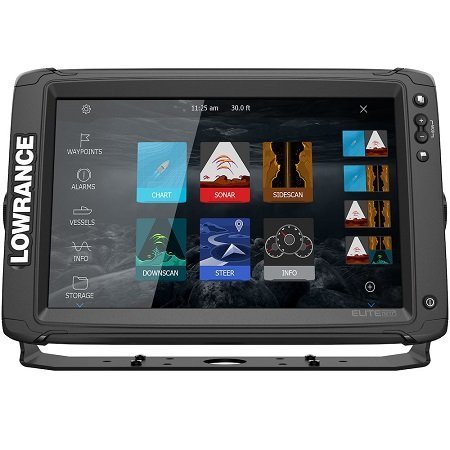
Lowrance Hook Reveal 7
The latest addition to the Hook family has been revised in terms of hardware (e.g. with the Solar-Max display) and, in addition to the usual fish finder functions, now also has a complete chart plotter with GPS that can be equipped with Navionics or C-Map nautical charts. In addition to a highly sensitive and stable running GPS module, all functions necessary in operation from (back)tracking to auto-routing are supported.
The map build runs sufficiently fast – large zoom jumps and memory-heavy overlays require smaller waiting times, but do not differ significantly from other devices in the price range. Using the fish finder functions, the Hook Reveal combo device then also succeeds in live mapping with C-Map Genesis Live. This can be used to produce, display and save your own individual waterway maps in real time.
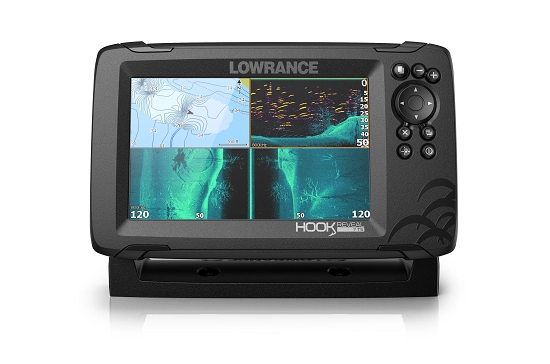
- Price: 530,90 € (incl. Triple Shot encoder)
- Suitable nautical charts: Navionics+ small
- Price: 133,50 €
- Total cost: 530,90 + 133,50 = 664,40 €
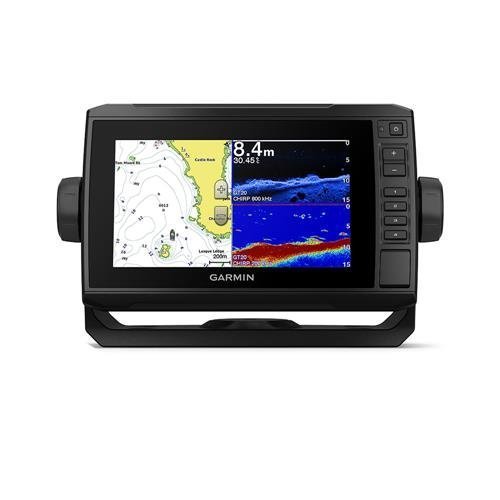
Garmin Echomap Plus 72cv with GT52M-TM transducer
As the most affordable 7-inch member of the Echomap Plus family, this Garmin fish finder is equipped with 2D Chirp and DownScan (DownVü). It also features touchscreen operation including keyboard support. The built-in chartplotter offers all the usual functions to navigate safely and accurately on the water. The GPS sensitivity is excellent, so that even difficult reception conditions are mastered without any problems.
The Garmin solution of marking the calculated route with a magenta-colored dual line, which shows the basic course (static line) and a dynamic line for the current course, makes navigation and course keeping very easy in practice. The wide, magenta-colored line follows the calculated optimal route, which can also pass over obstacles, for example. Within this is another narrow line that shows the current course, which avoids obstacles.
-
Price: 799,99 €
-
Suitable nautical charts: Garmin Bluechart G3 HD regular
-
Price: 135,00 €
-
Total cost: 799,99 + 135 = 934,99 €
b) Mid-range chartplotter with 9-inch screen (< 1400 €)
In this chapter, you’ll find our recommendations for mid-range combo devices up to 1400€, starting with the
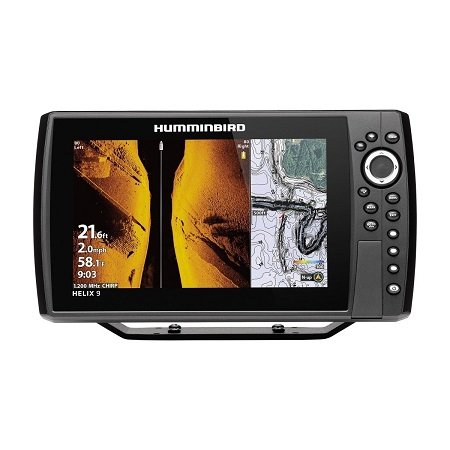
Humminbird Helix 9 CHIRP DS GPS G3N / model year 2020
This inexpensive combination unit with a large 9-inch screen only has a 2D chirp module integrated and does without more advanced fish finder technologies such as DownScan or SideScan. In return, the favorable purchase price, which also includes a suitable XT standard transducer, is an important argument for buying. On board is a full-fledged chart plotter with high-sensitivity GPS and live mapping function, which fully meets expectations in terms of performance, operation and accuracy. The hardware equipment of the Humminbird Helix 9 is also not fundamentally flawed in the class field.
- Price: 1069,00 €
- Suitable nautical charts: Navionics+ small
- Price: 133,50 €
- Total cost: 1069,00 + 133,50 = 1202,50 €
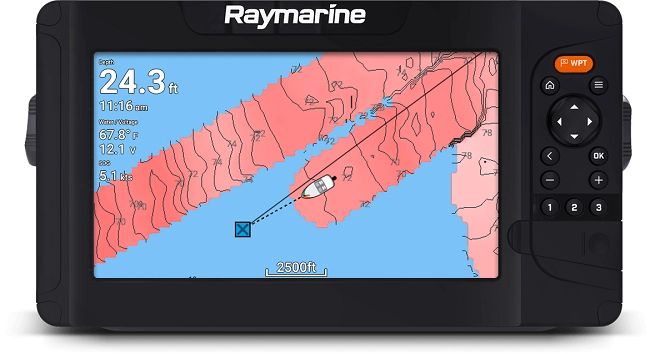
Raymarine Element 9 HV with HV-100 transducer
An absolute bestseller among the 9-inch devices. With four sonar functions including a 3D display, the device has a unique selling point in sonar technology with the quad encoder HV-100 – also in terms of price. Minor limitations can be found in the keyboard operation (no touch). The chart plotter basically offers everything that can be expected from a device in this price range.
All the usual functions and performance features including live mapping (Real Bathy) are present. Only the GPS sensitivity (as already seen in the 7-inch device) could be better. According to the manufacturer, however, the latest software updates should have remedied this. With Real Bathy, the Raymarine Element 9 HV now also offers personal nautical chart recording in real time.
- Price: 1109,00 €
- Suitable nautical charts: Navionics+ small
- Price: 133,50 €
- Total cost: 1109,00 + 133,50 = 1242,50 €
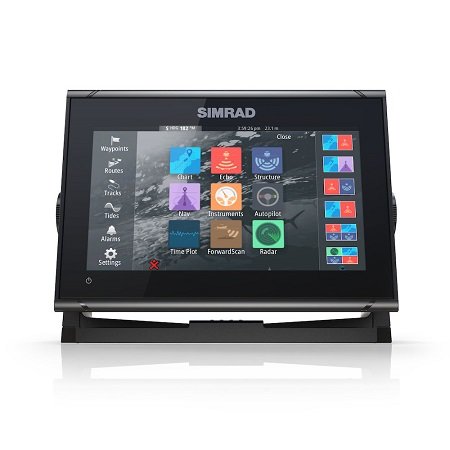
Simrad GO9 XSE with active imaging stern transducer 3-in-1
This device is an almost identical copy of the Lowrance Elite 9 Ti2 with the fish finder functions and the new active image encoder. In addition to 2D-Chirp and the StructureScan functions DownScan and SideScan, we find a very well-equipped chart plotter that includes all common navigation options with a highly sensitive GPS module. With fast navigation readiness and good accuracy, even demanding users will not miss anything in the device’s scope of features.
-
Price: 1249,00 €
-
Suitable nautical charts: Navionics+ small
-
Price: 133,50 €
-
Total cost: 1249,00 + 133,50 = 1382,50 €
c) 12-inch combination devices (from 2000 €)
Except for the 12-inch Garmin GPSMAP device, the other two models have already been discussed in the 9-inch devices. The Lowrance Elite Ti2 and the Simrad Go are practically identical – with the only difference that the Simrad Go also allows the use of Raymarine radars.
Raymarine Elements 12 HV with HV100 encoder
Equipped like the 9-inch model, only with a larger screen. Including the encoder, the purchase price remains just under € 2000.
- Price: 1919,00 €
- Suitable nautical charts: Navionics+ small
- Price: 133,50 €
- Total cost: 1919,00 + 133,50 = 2052,50 €
Lowrance Elite 12 Ti² with Active Image Encoder 3-in-1
This Lowrance fish finder is equipped with a multi-touch display including key support. With three scan functions, it is sonar technically best equipped in the chartplotter sector. In addition, there is a highly sensitive GPS and appealing navigation options – as described for the 9-inch Simrad Go.
- Price: 2299,00 €
- Suitable nautical charts: Navionics+ small
- Price: 133,50 €
- Total cost: 2299,00 + 133,50 = 2432,50 €
Garmin GPSMAP 1222xsv with GT52 encoder
Fully equipped combination device: Three fish finder functions, a fully equipped chart plotter, high-sensitivity GPS and extensive navigation options up to autorouting. In addition, there is a sophisticated keyboard operation with multifunctional control wheel on the high-quality keypad.
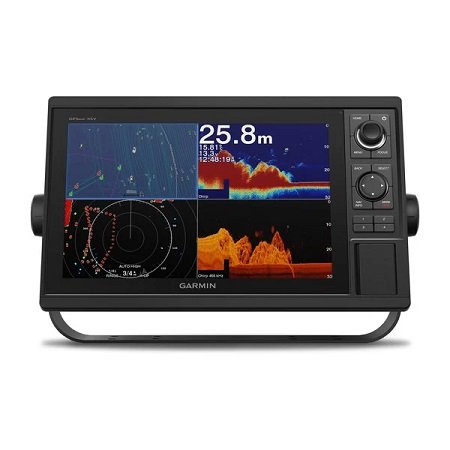
-
Price: 2742,00 €
-
Suitable nautical charts: Garmin Bluechart G3 HD regular
-
Price: 135,00 €
-
Total cost: 2742,00 + 135 = 2877,00 €
d) The alternative: The cheapest chartplotter solution with 10 inch screen (< 500 €).
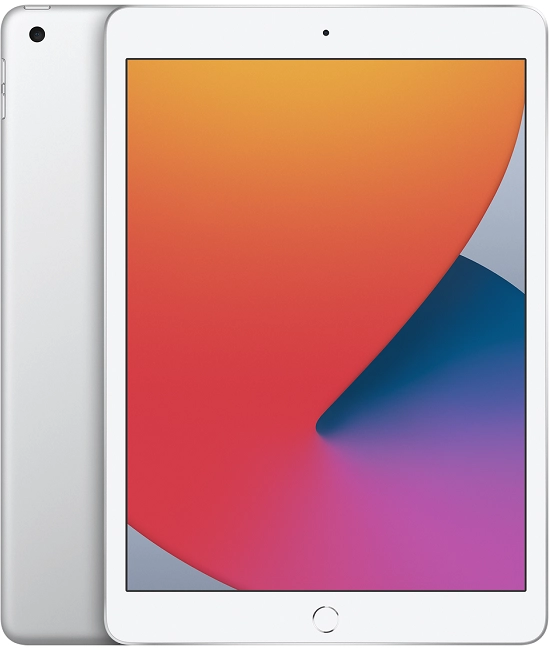
This proposal is not a chart plotter in the strict sense. It uses a universal tablet in 10-inch format and equips it with suitable accessories to make it suitable for boating. Functionally, this solution uses the Navionics boating app, which works with the same Navionics+ charts as many chartplotters from the relevant manufacturers.
Device recommendation: Apple IPad 2019 (10.2 inch)
The tablet is ideal for plotter use for three reasons:
- First, the built-in hardware (CPU, memory) goes hand in hand with an almost lag-free map build with and without overlays.
- Secondly, the screen is more suitable for outdoor use than the average tablet competitor.
- In addition, the device’s price is quite affordable and there is a comprehensive range of accessories from third-party suppliers.
The inexpensive 32 GB version of the iPad is perfectly sufficient for use as a plotter. Price: 329.00 €.
Necessary accessories:
For use on the water, a waterproof case must not be missing – as well as a mounting option via suction base or railing clamp, of course. There are plenty of waterproof housings for the iPad, but for our use on the boat, they unfortunately have to be combined with a clamp (with suction base) from another manufacturer. This combination, mostly designed for the car, is admittedly not the ultimate for boating.
The only really useful accessory for our purpose comes from Armor-X USA. The manufacturer not only produces the waterproof cases, but also the matching mounts. These can be clicked into the device on the back of the case (X-MOUNT). This is an extremely stable and wobble-free connection with a suction base that holds the heavy Apple IPad securely. Unfortunately, the Armor-X parts can currently only be ordered directly in the USA. From there, however, they are delivered in around a week (5-7 days) with the DHL shipping option ($20).
For those interested: MXS-A10S case ($69.99) and x14T mount ($24.99)
Price: €103.50 (including express delivery of $20).
For those who find this too inconvenient – or who would rather have return options and a warranty – the following accessories are recommended:
- MOKO case for IPad 2019. price: 48,99 €.
- Ibolt suction cup holder. Price 44,90 €.
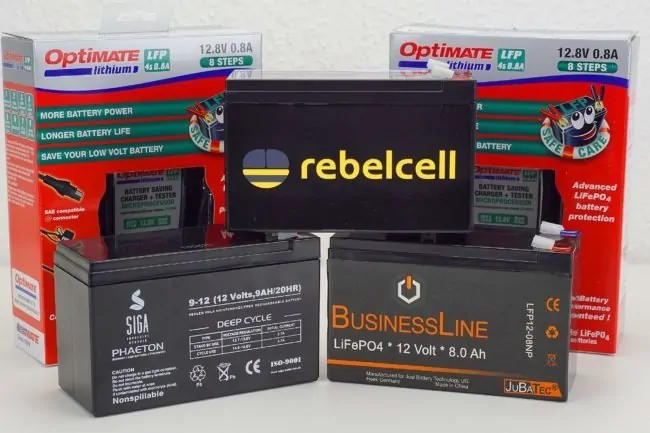
We also recommend an external power supply (fish finder battery), because the tablet’s battery will barely last a day of fishing when the GPS is active and the screen is at full brightness. A small – but powerful – external power supply with 10 Ah in the form of a powerbank can help. It is advisable to use a brand manufacturer for lithium cells, since they can also cause problems. We found a model in Panasonic’s EB-P1100C that can easily keep up with no-name products in terms of price. Price: €15.90
Nautical charts: The matching boating app from Navionics is available free of charge from the Apple Store (or Google Play). The Navionics+ nautical charts are downloaded with the app. The maps for all of Europe cost €42.50, smaller areas are correspondingly cheaper.
Total cost for this solution: 329,00 + 103,50 + 15,90 + 42,50 = 490,90 €. (Comparison: A 10 inch chart plotter costs more than 2000 € including maps).
-
The Ultimate Fish Finder Guide
Download 40 pages for free now
Reviews ( 17 )
- Rated 5 out of 5
Raphaël G
Very effective. - Rated 5 out of 5
Vladimir M
The book describes the fish finder physics and builds up your understanding of how it actually works. I have yet to apply this knowledge with my Humminbird, but having that much of theory is extremely helpful in understanding and processing the sonar output. - Rated 5 out of 5
NICHOLAS JOHN REECY
The Deeper Guide was just what I was looking for. YouTube is full of reviews of the sonar but little in the way of education. I highly recommend for those wanting to better understand their Deeper sonar. - Rated 5 out of 5
Henrik
I am a beginner when it comes to fishing with fish finders. For me, the book has been very informative to judge the displays on the fish finder "realistically" and to recognize what limits there are when searching for fish with the fish finder. Now I know when I have to use my regular sonar and when I have to use my ClearVü or which settings I should apply to the device at which spot. I was impressed by the many illustrations, especially for understanding the functions. - Rated 5 out of 5
Dr. Manfred Marx
Very well written, so that it is understandable even for amateurs and structured concisely. - Rated 5 out of 5
Andreas Witz
An excellent book for learning about fish finders. - Rated 5 out of 5
AK
The ultimate fish finder guide is a beneficial introduction. I am excited to put into practice what I have learned. - Rated 5 out of 5
Lübbe Wolfgang
A well-written problem solver. - Rated 5 out of 5
Kalksee
The book is unmatched for understanding how a sonar/fish finder works. I was a fish arch hunter, and I suspect my fishing tactics will change. The book has clear writing, and you understand you understand a lot the first time you read it. I can only recommend it to anyone interested in technology. Thank you for this fantastic book! Thoralf - Rated 5 out of 5
Enrico Indelicato
I had absolutely no idea about fish finders. Since I read the book, I had a real Aha experience! For me, as a beginner, very detailed and uncomplicated explained. I can only recommend it! Best regards Enrico - Rated 5 out of 5
Udo
Reading this book has suddenly made my fish finders much more valuable to me! I realized that I made typical mistakes in interpreting the images, which I will now avoid. The authors use clear, understandable language and also explain the mathematical-physical basics very well. The fact that there is no advertising for one or another fish finder manufacturer has increased its credibility. At the same time, you get a solid impression of what is feasible today on this subject - and the "advertisements" of the manufacturers also helped. The book is ABSOLUTELY to recommend, because what good is an expensive fish finder if you too often draw the wrong conclusions from the obtained illustrations? In this respect, the money for the book is very well invested. - Rated 5 out of 5
Josef Weiss
I had to wait a long time for such great explanations. Thank you. - Rated 5 out of 5
Peter
It is a well-described, scientifically sound book highly recommended to anyone who wants to advance and doesn't already know everything. - Rated 5 out of 5
Holger Just
Ich angle seit Jahren mit Echolot. Aber erstens bleibt man da irgendwann auf einer bestimmten Verständnisstufe stehen, diese konnte ich durch dieses Buch um einiges anheben. Als zweiten Aspekt mußte ich nach dem Lesen dieses Buches erkennen, dass ich durch "gefährliches Halbwissen" jahrelang Fehlinterpretationen hatte bzw. die Möglichkeiten meines Lotes nie richtig ausgenutzt habe. Also mein Fazit : Sehr empfehlenswert, die komplexen Zusammenhänge sind verständlich beschrieben. Das Buch ist ideal geeignet um sich in der angelfreien Zeit wertvolles Wissen für die folgende Saison anzueignen und beim Thema Echolot wieder uptodate zu sein. - Rated 5 out of 5
Matthias Wappler
Sehr gut!! - Rated 5 out of 5
M. Hermanns
Wer dieses Buch nicht liest, ist selber Schuld! Kein Vortrag, kein Presseartikel oder Bericht, Nein sogar keine Online-Schulung oder gar ein 365 Tage Support, vermittelt so viele essentielle Kenntnisse, wie dieses Buch. Nach zwei drei bebilderten Erklärungen wird dir klar, das ohne dieses Wissen, die Gewinn bringende Nutzung eines Echolotes gar nicht möglich ist. Beziehungsweise dir wird klar das du dein Echolot bisher sehr ineffizient genutzt hast und das dir eine Menge verborgen geblieben ist. Ich habe nach dem ersten gleich drei weitere Exemplare gekauft und drei guten Angelfreunden eine Anerkennung für unsere Freundschaft mit diesem Buch gemacht. Alle drei verfügen über 30 Jahre Bootsangelerfahrung und alle drei waren ebenfalls begeistert, jeder konnte sein Wissen deutlich erweitern. Deshalb freue ich mich auch so sehr auf das Zanderbuch welches hoffentlich noch vor dem Wochenende bei mir ist. Liebe Grüße weiter so. dermarc - Rated 5 out of 5
TACKLEFEVER
Das Buch beginnt mit rund 15 Seiten Technik Erläuterung bei der versierte Echolot Nutzer, zu denen ich mich zähle, vielleicht geneigt sind weiter zu blättern weil sie vieles schon wissen und Anfänger weiter blättern möchten weil es zu trocken scheint. Aber etwas Basiswissen gehört einfach dazu. Selbst wenn man als Anfänger bei der Basis Theorie weiter blättern will, sobald es um Chirp geht sollte "jeder" genauer hinschauen 😉 es lohnt sich. Und auch für mich fand ich noch ein zwei kleine Dinge die ich nicht wusste oder noch nicht im Zusammenhang mit anderem sah. Die weiteren Abschnitte (bis Kap. 3) befassen sich mit den verschiedenen Techniken der Geber, Bildschirme, oder dem Smartphone, dem Tablet als Anzeigemedium. Was mir bis dahin sehr positiv auffiel waren die "MERKE-Boxen", kleine übersichtliche Passagen welche Kerninformationen des zuvor vermittelten Wissen zusammenfassend hervorheben. Auch wenn man nicht alles komplett verstanden hat, hilft diese leicht verständliche Zusammenfassung des voraus gegangenen Inhalts sehr. Kapitel 4 geht auf 2D, Down-Imaging, Side-Scan-Sonar ein, dabei ohne zu konkret auf einen Hersteller abzustellen was ich ebenfalls sehr positiv fand. Dem Angler wird der praktische Einsatz und das Verstehen dessen was man auf dem Echolot sieht erläutert. Fragen wie z.B.: Wo befindet sich der Fisch genau? Was ist eine Fischsichel? Wie setze ich das Echolot beim Vertikalangeln ein? Warum gibt es Vertiefungen obwohl man keine sieht und umgekehrt? Wie erkenne ich die Bodenbeschaffenheit? Fragen zur richtigen Deutung der Unterwasserstruktur, dem optimalen Bildlauf- und Boots- Geschwindigkeit, der Sprungschicht, usw. werden auch beantwortet. Würde ich alles aufzählen würde es hier zu weit führen. Es folgen noch kurze Infos zur Multibeam Technik und ein Kapitel "Die 3D Show mit Garmins Panoptix". Hier wurde für mich zu wenig Wissen vermittelt, nur auf einen Herstellers gezeigt und nicht auf ähnliche Funktionen oder Techniken anderer Hersteller Bezug genommen. Ich hoffe es kommt in der nächsten Auflage mehr zu dem Thema. Am Ende des Buches kommen Infos rund um konkrete Einstellungen am Echolot. Hier wird einer der wichtigsten Punkte überhaupt behandelt und dies praxisnah und hilfreich. Aller spätestens jetzt lohnt sich das Buch für alle Neueinsteiger. Viel einfacher und kompakter geht es kaum. Ein paar wichtige zuvor besprochene Punkte zu Einstellungen bei bestimmten Echolot Funktionen werden erläutert und mit Checklisten im Kapitel "Die effektivsten Einstellungen beim Echolot auf einen Blick" zusammen gefasst. Hier lohnt es sich für Anfänger die Seiten besonders aufmerksam zu lesen und vielleicht als Kopie mit auf Boot zu nehmen. Damit fällt der Kampf mit den gefühlten tausenden von Einstellungen am Echolot auf dem Wasser leichter. Es klingt fast zu schön um wahr zu sein, aber tatsächlich scheint mir das Buch für Anfänger und Fortgeschrittene Anwender gleichermaßen gut geeignet zu sein. Manchmal suchte ich mehr Hintergrundwissen, weil der im Prinzip sehr gute Ansatz es für Anfänger leicht verständlich zu halten manche Herstellerabhängige Feinheiten außer Acht lässt. Das Buch hat eine gute Gliederung, fasst vieles kompakt zusammen und geht bei wichtigen Punkten auch meist für Fortgeschrittene etwas in die Tiefe. So richtet sich das Buch meiner Meinung nach nicht an wissenschaftliche Anwender, sondern an Echolot Neulinge indem es auch viele Basis Fragen beantwortet ebenso auch an Fortgeschrittene indem es auf diverse Punkte tiefer eingeht. Wenn ich den Sinn des Buches in einem Satz beschreiben sollte, dann wäre dies: Echolottechnik für Anfänger interessant und verständlich erklären und dabei auch ein wenig tieferes Wissen für alle zu vermitteln. Mir ist Stand Juni 2017 kein anderes Buch bekannt das diesen Ansatz so konsequent verfolgt. Ich hoffe ihr habt so viel Spaß beim lesen wie ich. Luke www.tacklefever.de
This brings us to the end of our detailed article about chartplotters and how to use them. If you are still unsure about which fish sonar to buy, you can have a look at the other fish finder reviews in our extensive fish sonar test or write us a short message. Have fun on your next angling trip and “Petri Heil” – Jan and Martin.
Could you take 1 Click to share your experiences?
We will be forever grateful. With your rating we can improve.
average rating 4.7 / 5. Number of ratings: 75
Be the first to rate this post!

Raphaël G
Vladimir M
NICHOLAS JOHN REECY
Henrik
Dr. Manfred Marx
Andreas Witz
AK
Lübbe Wolfgang
Kalksee
Enrico Indelicato
Udo
Josef Weiss
Peter
Holger Just
Matthias Wappler
M. Hermanns
TACKLEFEVER