
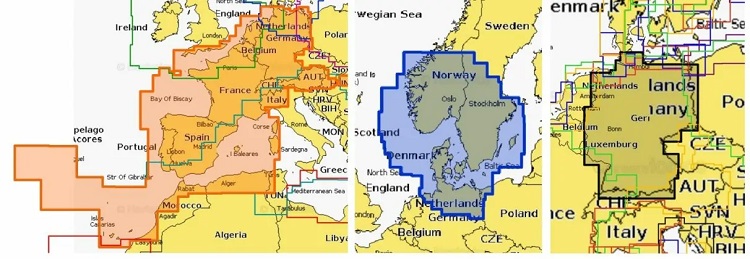
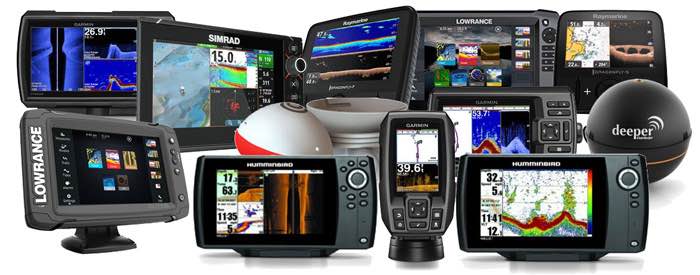
In the field of electronic navigation and hotspot search on the water, the Italian manufacturer Navionics is the best known, because it can handle the hardware (chartplotter) of different suppliers as well as mobile devices (cell phone and tablet). It is therefore rightfully considered the market leader in the field of digital nautical charts and maps for fishing.
Who owns Navionics?
After the restructuring in the course of the merger with Garmin (2017), Navionics has further expanded its supremacy in the supply and commercialization of electronic nautical charts.
With the first integrated Navionics Garmin data product (released in 2019), the manufacturer serves virtually the entire chartplotter market. Even though the Garmin Bluechart G3 charts are not compatible with the Navionics products for the other echo sounder manufacturers.
In addition, there is the huge user pool of the Navionics app via smartphone and tablet (Android equally as Apple iOS).
The question remains, what advantages do we as anglers and boaters have from the Navionics charts – and whether we even need nautical charts for our favorite pastime? We are going to answer this question during the course of this article. As well as we do not want to leave other frequently asked questions on the subject of Navionics unanswered.
What’s the difference between Navionics and Navionics Plus?
Navionics has two product lines of water and nautical charts, which differ in a number of features.
- Navionics+
- Navionics Platinum+
What is Navionics plus? (the standard solution): Provides complete nautical chart information from near the coast to the open sea, as well as navigation data on rivers and about 40,000 inland waters around the world.
In addition to comprehensive chart material (navigation charts), Navionics+ also includes bathymetry charts (fishing charts) with high-resolution depth contours (depth charts) and a variety of local information (community edits).
Advanced features such as autorouting (jetty to jetty navigation suggestion), Sonar Charts Live (create your own charts) and a variety of options for personalized settings are also integrated.
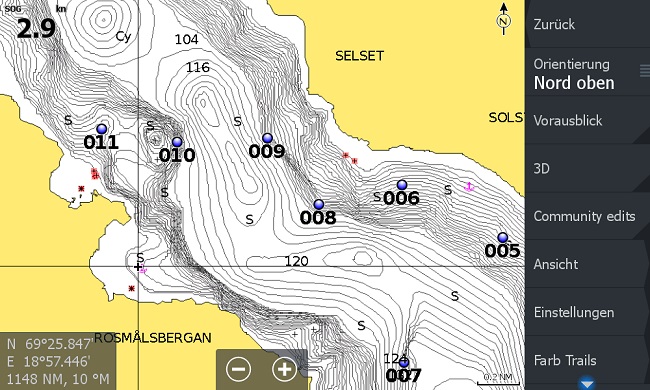
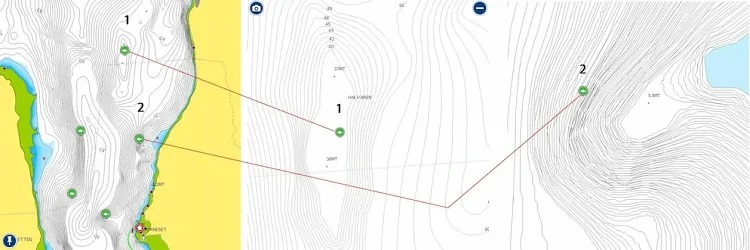
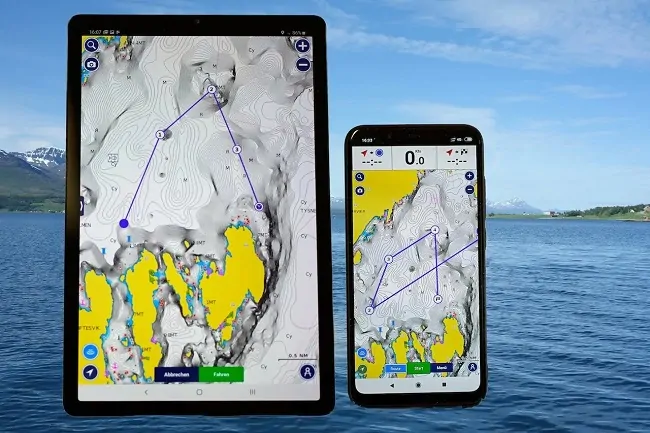
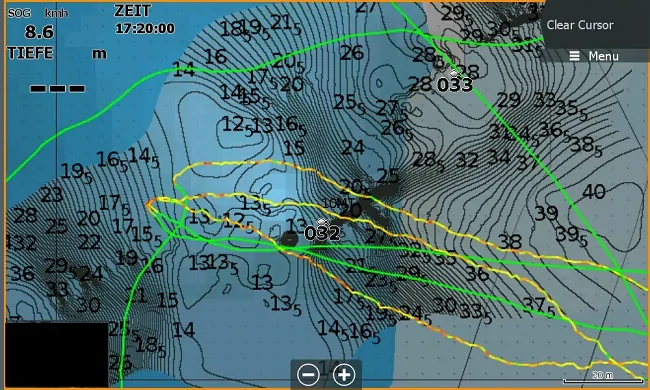
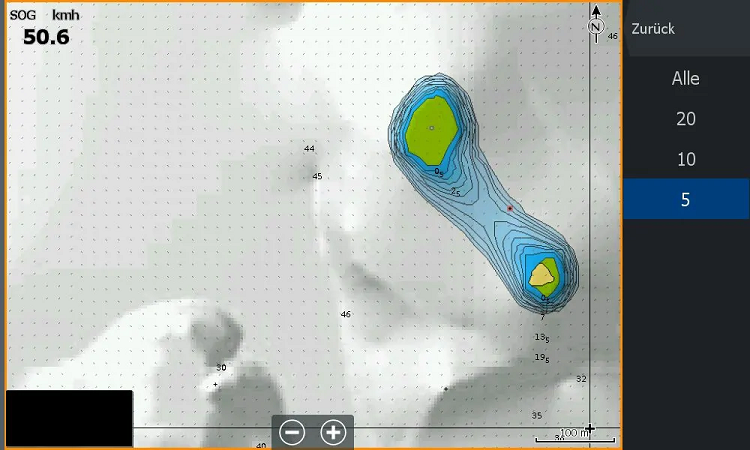
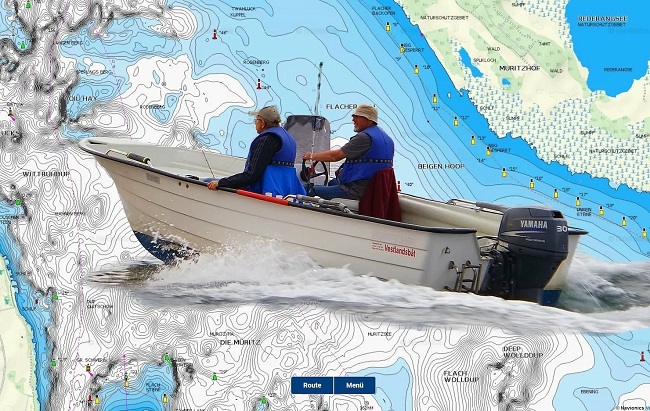
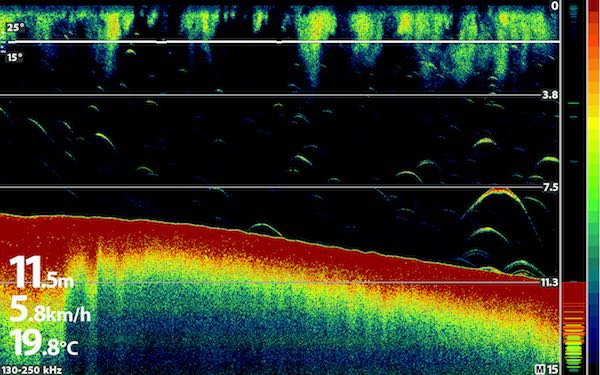
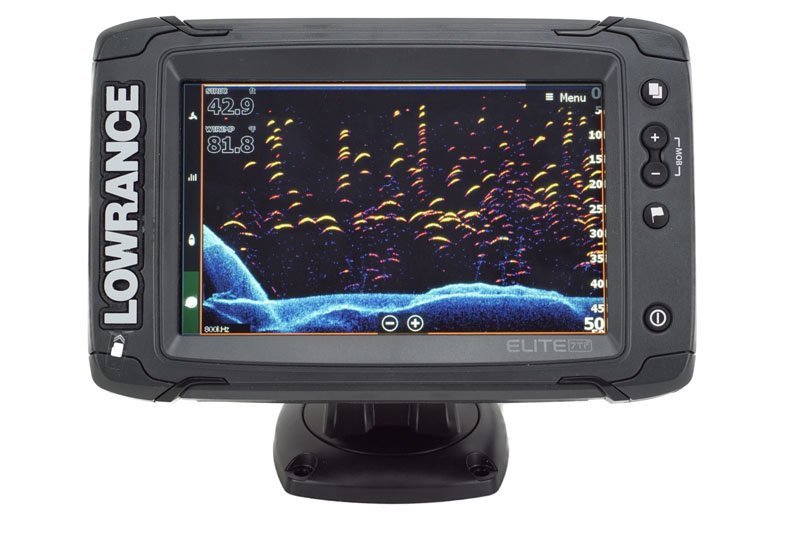
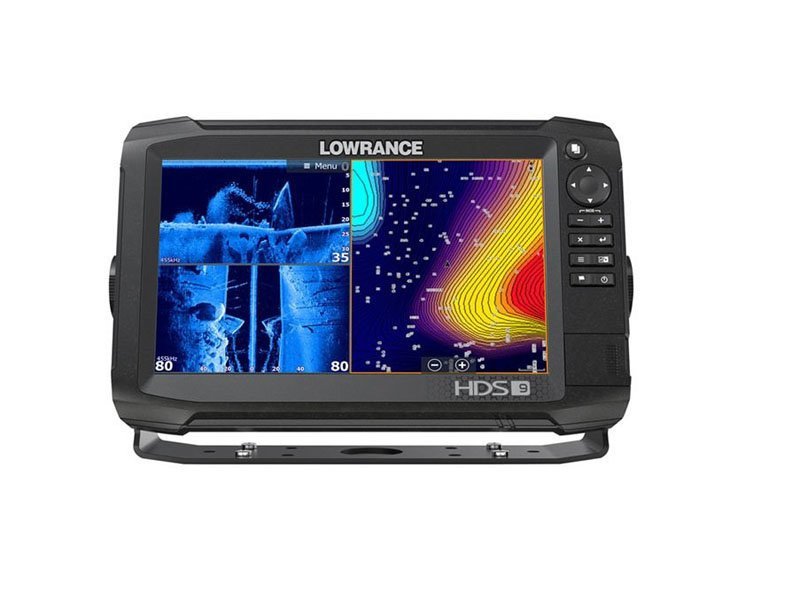
Navionics+ charts fishing map on a Lowrance HDS Carbon. The section shows a fjord passage south of Tromsø (Norway) with already set waypoints (no. 5 – 11) where hotspots are suspected.
On how many devices can you use Navionics?
With the GPS maps, this is easily done by switching them from one fish finder to the other.
The app stores allow you to install the Boating App on multiple devices: Up to 6 for Apple and an infinite number for Android.
Each purchased region is stored in your Navionics account and can therefore be restored on any other mobile device within the app.
To do this, simply download the Boating app and log in to it with your user details (email and password). Once logged in, your subscriptions and favorites (markers, routes, tracks) are restored.
You can check your purchases and subscriptions by going to Menu > Profile (your name) > Subscription. If they are not available there, just select the “Restore purchases” button further down the screen.
What Navionics card do i need?
a) Chart plotter or boating app on a mobile device?
First of all, this is a question of cost. If both the plotter and the tablet are already present, the prices for the maps are much higher for the former. Accordingly, the additional price for updates is also higher.
However, the lower map price is offset by the fact that the hardware of a smartphone or tablet is poorly adapted to the intended use. Both devices are usually not suitable for outdoor use. Only chart plotters have water protection and a sunlight-suitable screen.
Mobile devices also have poor energy reserves for long days of fishing. In addition, the handling is inconvenient if you want to use a fish finder in addition to the chartplotter. This is much more comfortable with a plotter combination device.
Nevertheless, a smartphone/tablet solution is not only recommended as a backup for the plotter operation under certain conditions. Regarding that, see our
Tip 1: Before you make a purchase, you have the option of a free trial version for the “Sea and Lakes” boating app. So what could be more practical than to test the navigation and hotspot search with the Navionics nautical charts for two weeks free of charge?
b) Area coverage: “Small” or “large”?
The price difference between both sizes is about $ 100. For the updates the additional price is $ 50. In case of doubts, we would recommend the smaller version if the area coverage is currently sufficient and is not likely to expand in the future.
Tip 2: For those who use their nautical charts only once a year for a short fishing trip, the Boating App on their smartphone (or better on a 10-inch tablet) of at least 5 inches should be enough for cost reasons. You always have your cell phone with you anyway, and a small holder with a suction cup from your car is usually sufficient for attaching it to your boat.
c) Is the extra price for the Navionics Platinum Plus chart version worth it?
First of all, the 3D maps are exclusively for plotter use. For the Boating App, there “only” exist the Navionics Plus maps. With an additional price of around $ 100, it is crucial how the personal added value is assessed.
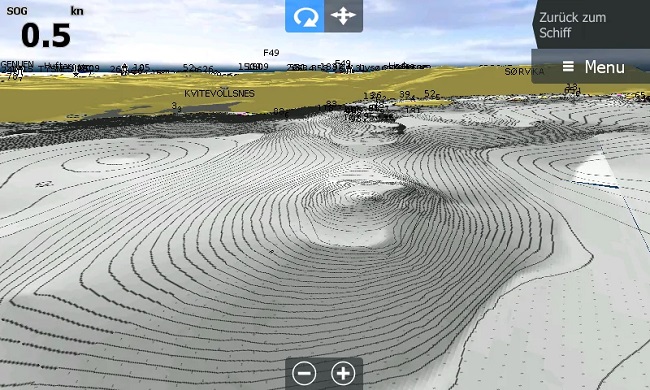
For evaluating the information on the map, one can also get by without a 3D display, even if it is clearly more informative in three dimensions. Anglers will also be able to do without the satellite and panorama photos, which are, however, all the more important for larger vehicles when mooring.
Tip 3: The boating app on the smartphone should be installed in any case, regardless of your plotter equipment, with all currently fished areas. As a backup to the chart plotter, it’s a must, and when you’re on the water with someone else’s boat, it’s an extra measure of safety.
Navionics maps for chartplotters
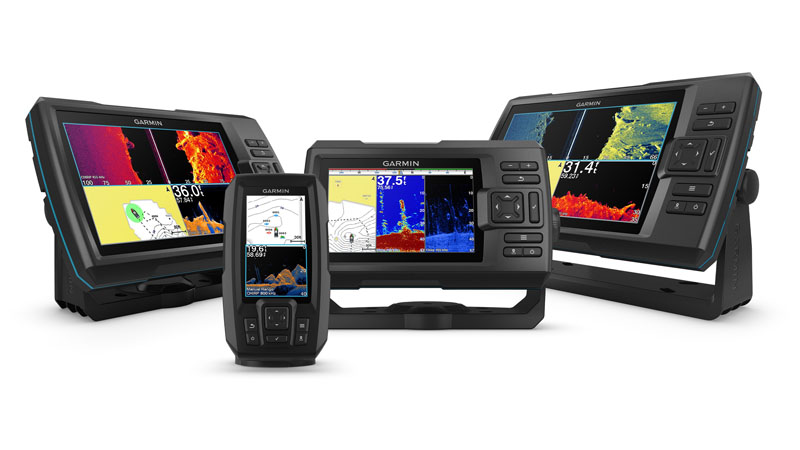
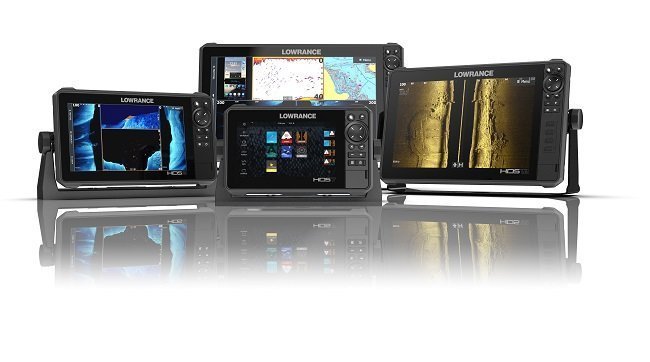
Navionics nautical charts work on virtually all plotters from major manufacturers such as Lowrance, Simrad, Humminbird and Raymarine.
A change between the devices of these providers is possible at any time without problems, if the same data storage medium is used and a connector for it is available. A special device adaptation is not necessary.
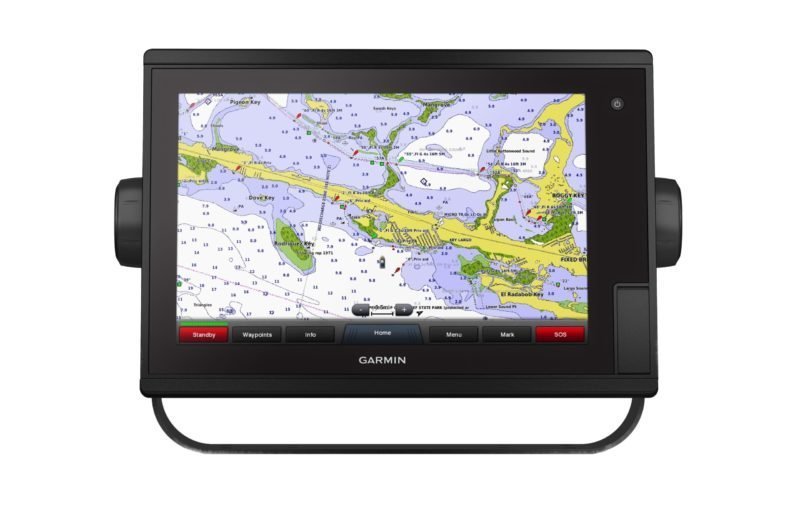
Will a Navionics card work in Garmin plotters?
All Garmin echo sounders, on the other hand, require Garmin Bluechart G3 charts, so they are not compatible with the rest of the Navionics chart material.
Will Navionics work on Humminbird (Helix 7)?
Many Humminbird displays (inlcuding the Helix 7) are compatible with Navionics chart cards: Navionics+, Platinum+ e Navionics Updates. For the best experience and most current feature set, be sure your plotter software is up to date. Check the Navionics compatibility guide for more details.
Will Navionics work without cell service?
The navigation with the plotter works offline. Online access is only necessary for a map update.
Do I really need nautical charts for fishing?
Anyone who owns a depth sounder or a separate chart plotter will
- regularly be out on a boat.
- As well as certainly not only fish the local carp pond.
In the event that both of these conditions are met, high-quality nautical charts are highly recommended.
Only in this way can the plotter make full use of its capabilities and provide the angler with the necessary information.
- This starts with the safe navigation of the area,
- the targeted approach of hotspots,
- reliable orientation in poor visibility
- to the unproblematic re-finding of rewarding fishing spots.
In the end, the result is always the same: “More fish on the hook”. How this works exactly, we will explain in more detail in the further course of this article.
What are Navionics sonar charts?
Unlike fishfinders, nautical charts cannot look underwater, nor are any fishing spots marked on them. Fish are always on the move, on the move to find abundant food sources.
So it makes sense to find exactly those places where food streams can be expected under certain conditions. Fish populations will automatically be there at certain times.
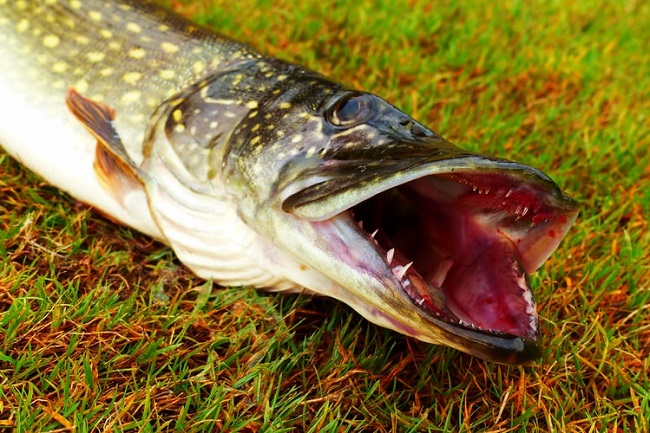
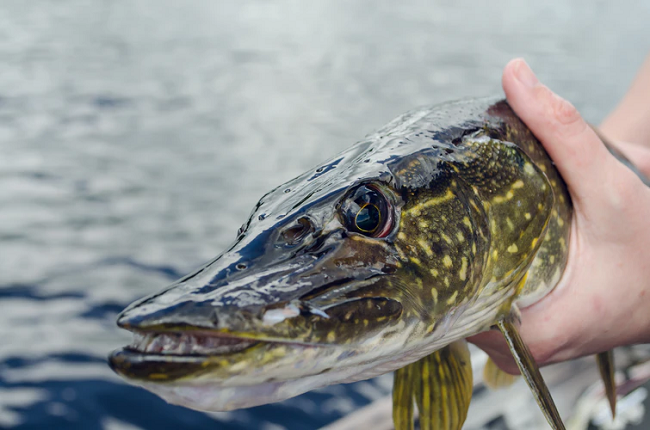
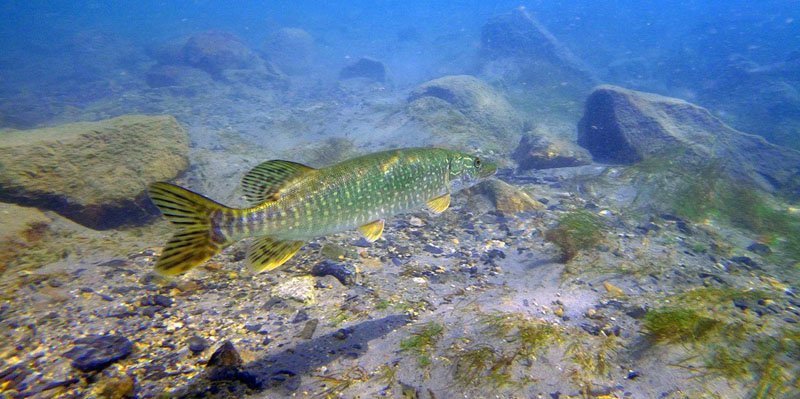
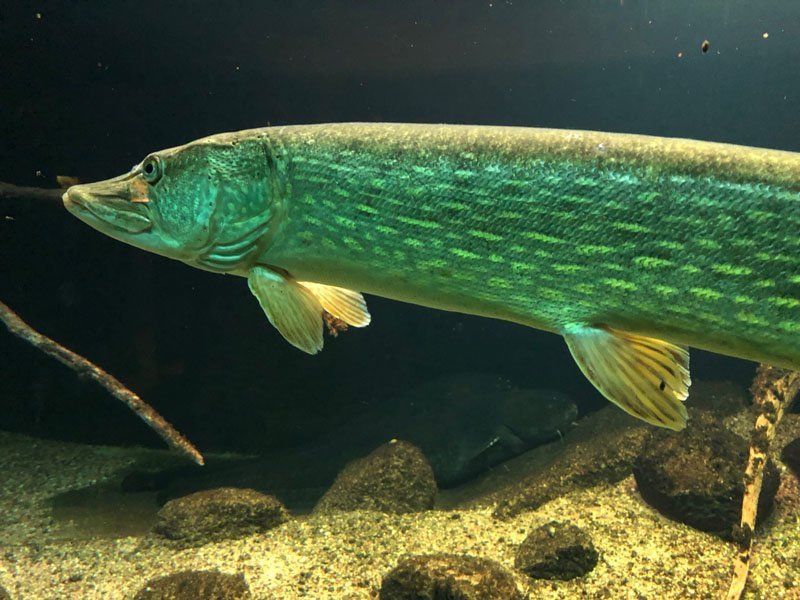
We know from experience that with rising water, transitions from deep to shallow in all possible constellations (rising channel, edges, breaks, plateaus, underwater mountains, etc.) magically attract fish. First the schools of small fish and in their wake the predators, such as the pike arrive.
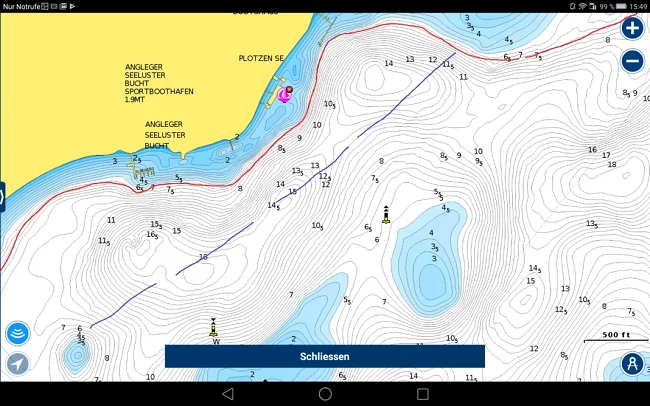
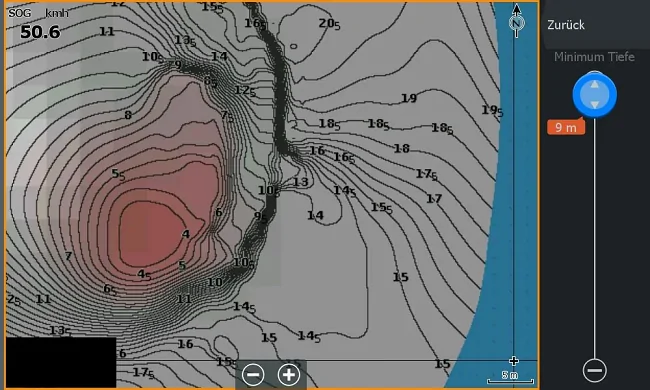
To find such spots, all you have to do is study the depth contours of your target area on the fishing map. This makes it easy to find promising fishing spots even before the fishing trip. Always true to the old truism “Only those who know where the fish are will catch them”.
You can then mark the presumably catchable spots on the map (enter a waypoint) and use the command “Navigate to” to get there.
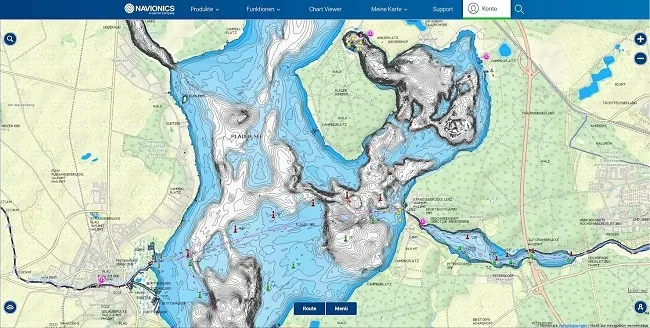
The advantages of the Navionics web app?
First of all, you can use it to get to know your local waters better and plan your next fishing trip. It’s also great for exploring unknown waters from a distance while you’re planning your trip.
This way you don’t waste time looking for hotspots on the water and can concentrate on fishing. On the water, however, you won’t get far without the boating app or the chartplotter version.
The web app does show you where the hot spots are. However, it is more advantageous if the GPS then plumbs you to within a few metres of this promising fishing spot.
What does the Navionics web app cost?
Nothing at all. The web app is free of charge – a great service from Navionics.
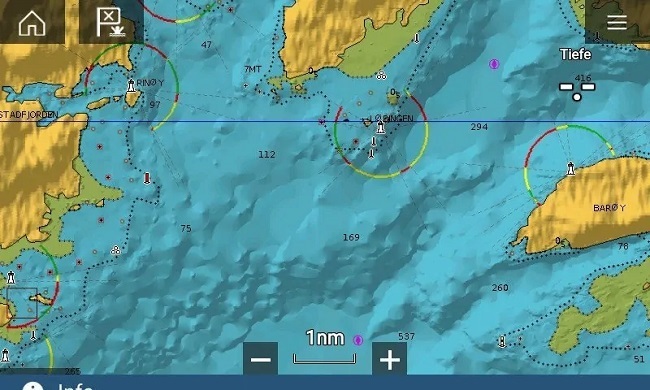
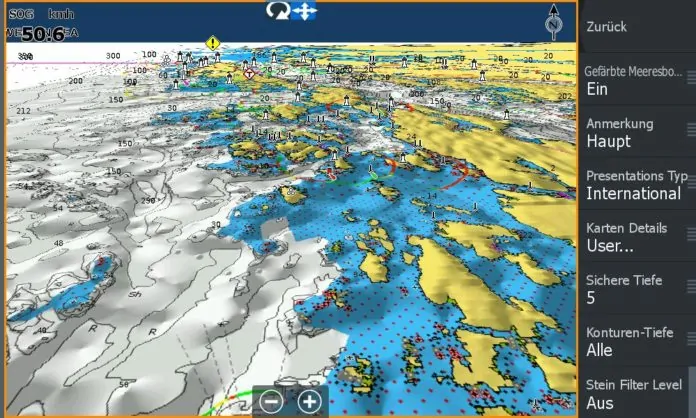
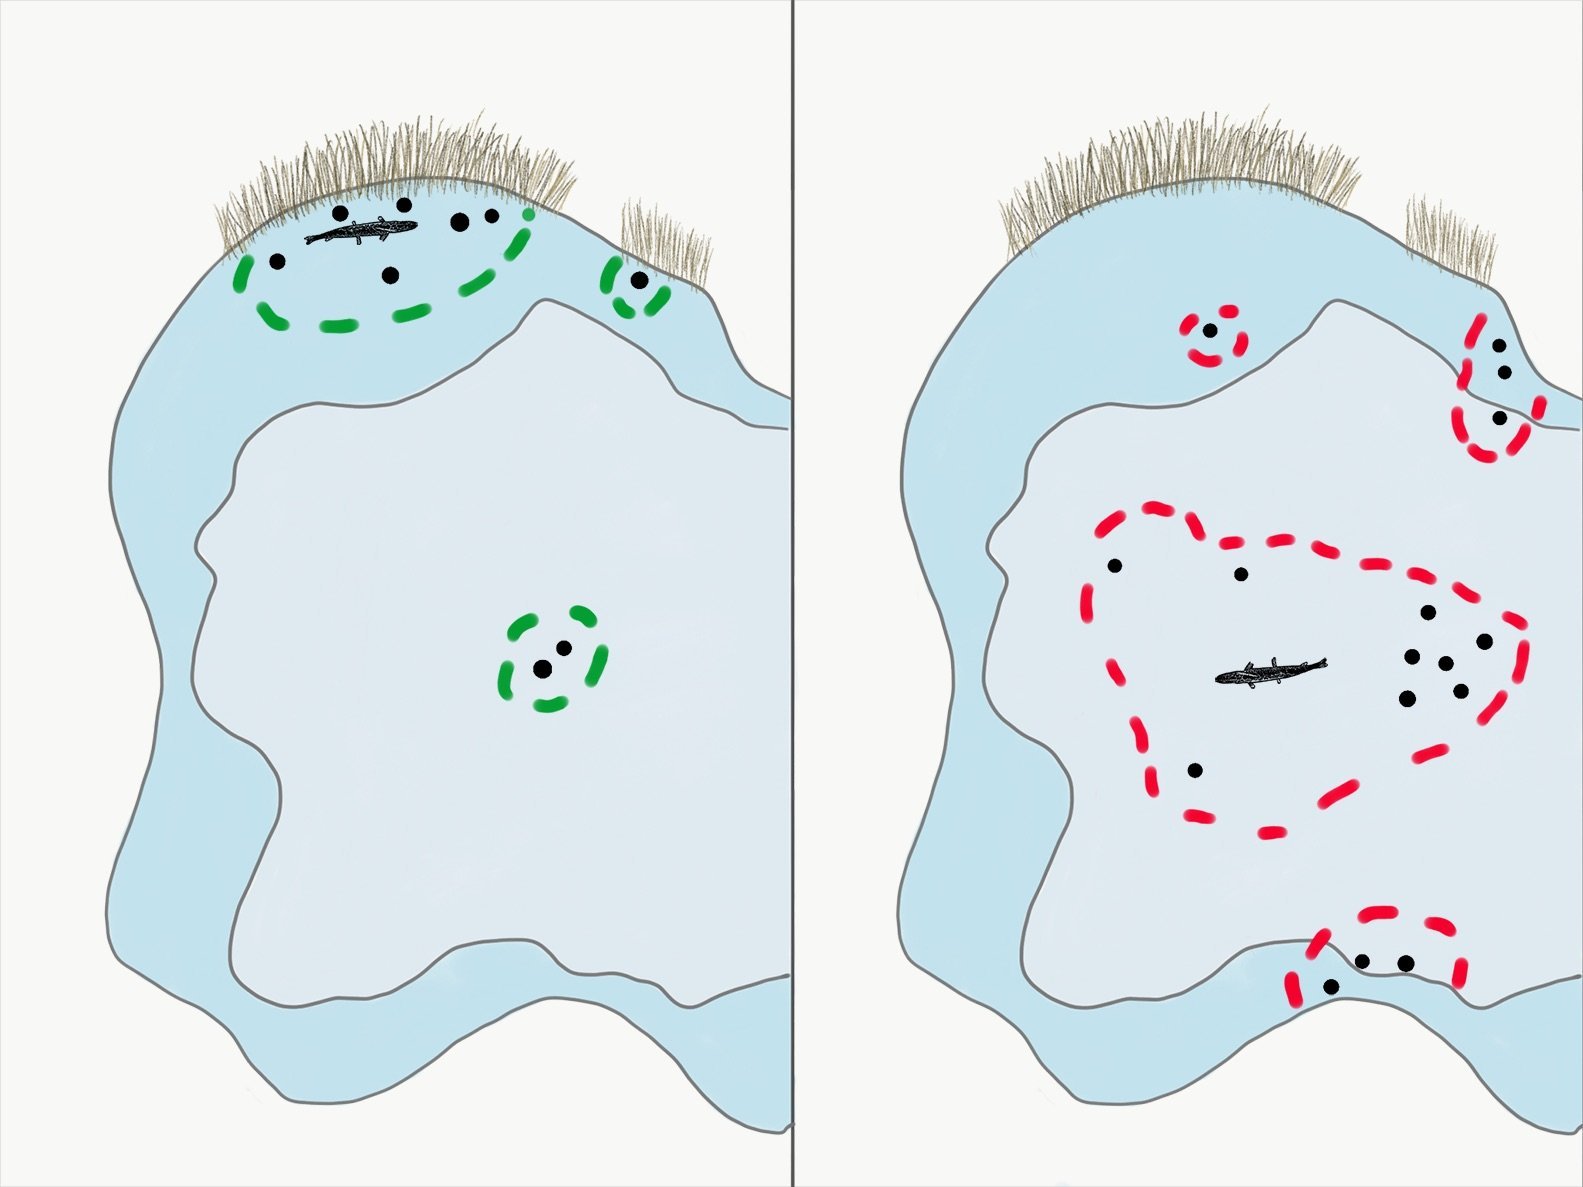
How do I interpret the map details?
The map includes all the water data anglers need. The most important of these are the depth contours. With the help of these you can find sloping edges and raised areas that are rich in fish.
Especially in larger waters, such as our house water, the Müritz, there are many good spots and even more places where there are no fish. Fish are at places that are rich in food, and it is precisely these that the maps of the Navionics Webapp show you perfectly.
Here you can find the Navionics Webapp.
Navionics also offers extremely informative and helpful online seminars. Here, the echo sounder professionals show you how to use the water charts correctly. This way, you’re guaranteed to find the best fishing spots – no matter whether it’s summer or winter.
By the way, Lowrance is a permanent partner of the Navionics webinars. The lectures are in English and always come with a presentation with slides. In addition, most webinars are uploaded to the Navionics YouTube channel afterwards.
What is the Navionics app?
Navionics first offered the Boating App for smartphone and tablet in 2008. From then on, it underwent various programme adjustments and name changes with different objectives before finally being completely redesigned in 2018.
Currently, only a so-called jacket app is offered under the name “Navionics Sea and Ocean”, which can be downloaded free of charge from the Google Play Store for Android or the Apple Store for iOS.
However, this basic app is no more than the program framework of the “plotter”, which still lacks the nautical charts themselves. These must be downloaded within the app for a fee, as without them the usefulness of the application is not particularly great.
What are the advantages of the Boating App?
You probably always have your smartphone with you when fishing anyway. We have solved this for ourselves by having a waterproof case for the iPhones on the water. This is where we display the current position on the set route.
In addition we use the echo sounder for the sonar and the DownVision display. Since we do not want to spend 1,500 EURO for a giant display, we have the full flexibility of the three different displays.
Other advantages of the Sea and Lakes app:
- You can, whether you are boating or not, plan your fishing trip accurately.
- You’ll always have a local and up-to-date fishing map with you on any vacation!
- If you use a Lowrance, Raymarine or Garmin echo sounder, you can synchronize the sonar charts with your smartphone, as their display is supported.
The display on a tablet is of course much more comfortable than on a smartphone. You can enlarge the zoom and see more details. When using a tablet, it is of course worth having a waterproof case and a card slot so that the current GPS position is displayed at all times.
If the tablet is used in combination with an echo sounder or combination device, you can easily transfer its GPS images wirelessly and thus use a large 10-inch screen, which would otherwise be quite costly.
Ultimately, this means a tablet could even function as a stand-alone plotter with Navionics+ charts. As well as a secondary screen for a sonar device. That’s quite something, isn’t it?
How do navigation and hotspot search work with the Boating App?
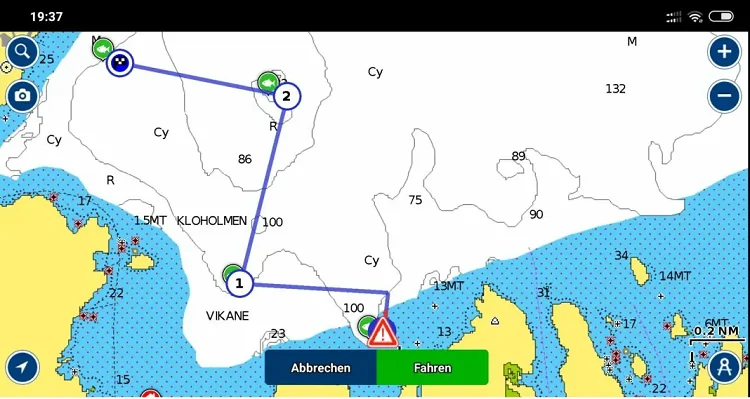
Only a few steps are necessary to navigate to a specific hotspot.
- First, you create waypoints for the hotspots and save them.
- The plotter assigns numbers to the trackpoints in the order in which they are entered. This is done either by coordinates or simply by marking them on the screen.
- You can now – but of course you don’t have to – use the waypoints to define a tour.
- To navigate to a waypoint or along a tour, you afterwards select the navigation command in the menu.
- The plotter then sets the start-finish line (direct course) and you can start directly.
The guidance line makes it easy for you to stay “on course” and follow the shortest possible path. The path taken while navigating is recorded on the map as a “track” so that you can keep track of it at any time.
These tracks are very helpful in case of sudden visibility obstructions (smoke, fog, darkness). They can be reversed via the navigation menu, so that you can find your way back even with limited visibility.
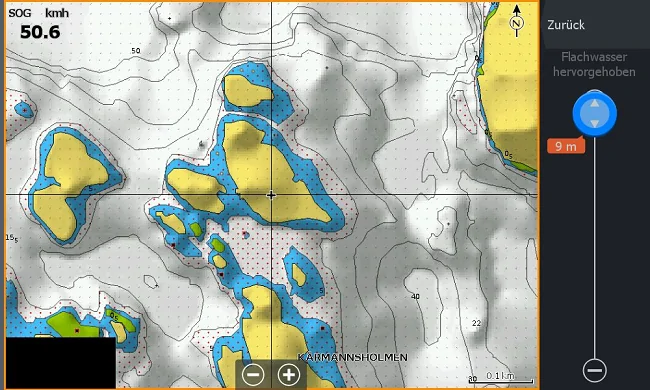
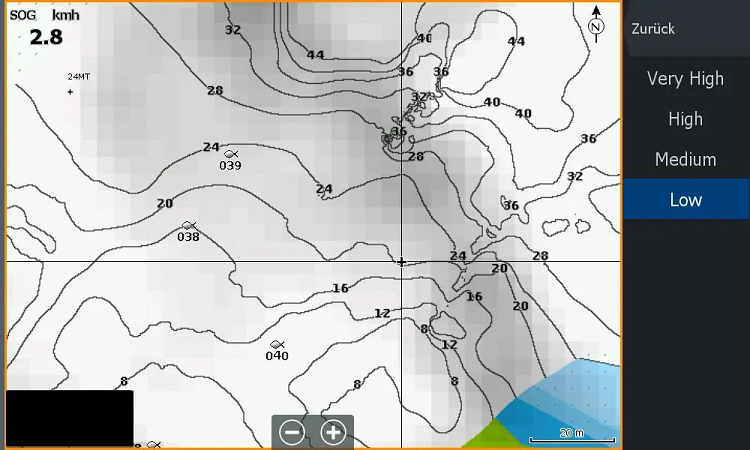
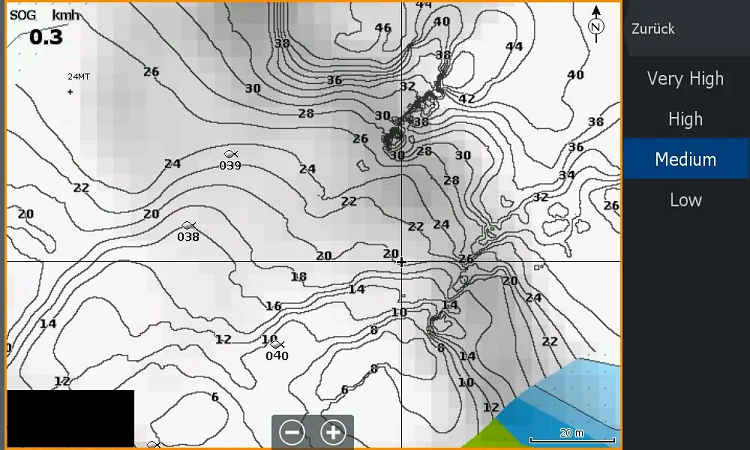
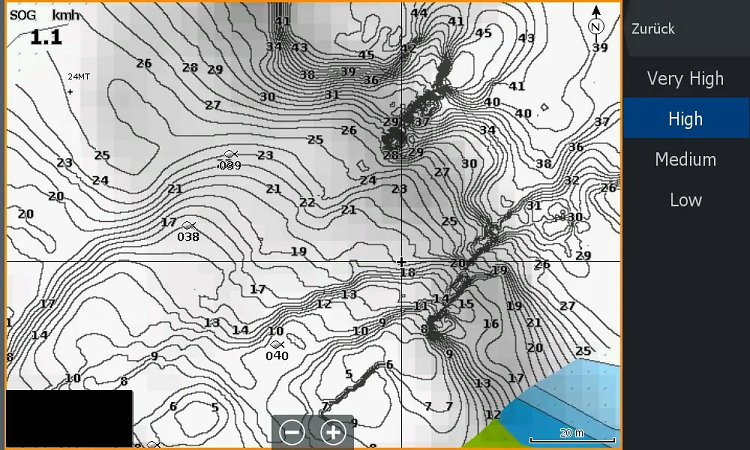
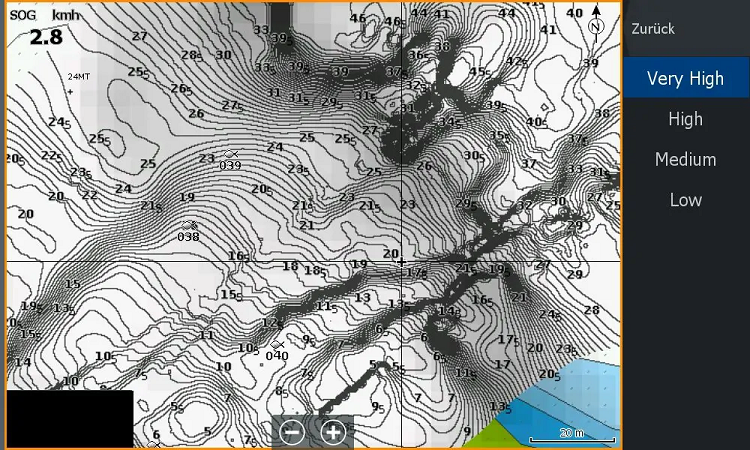
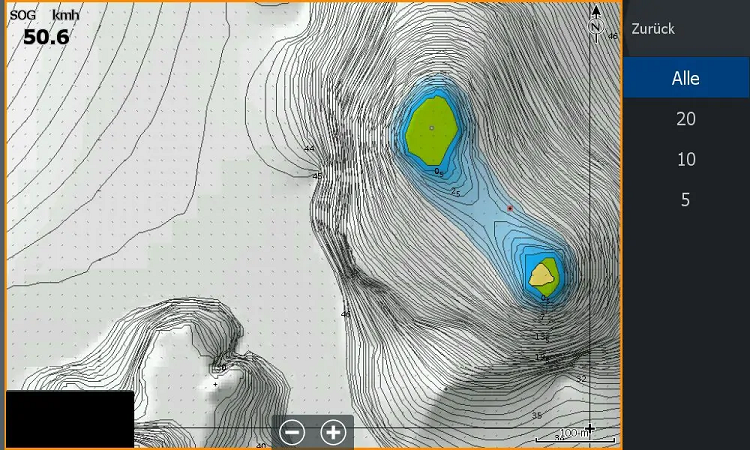
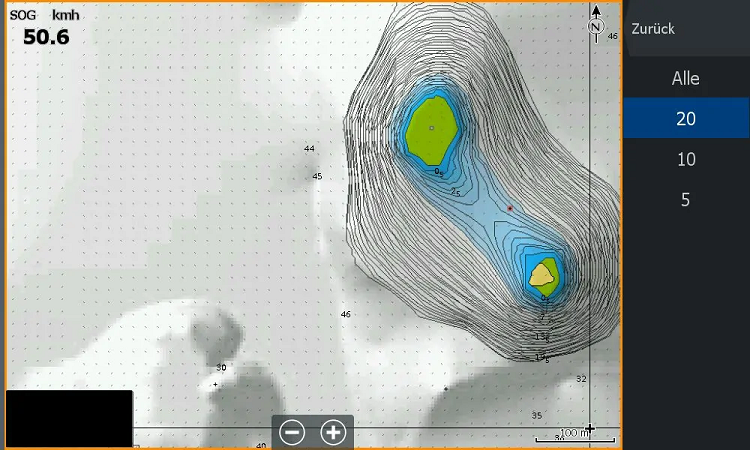
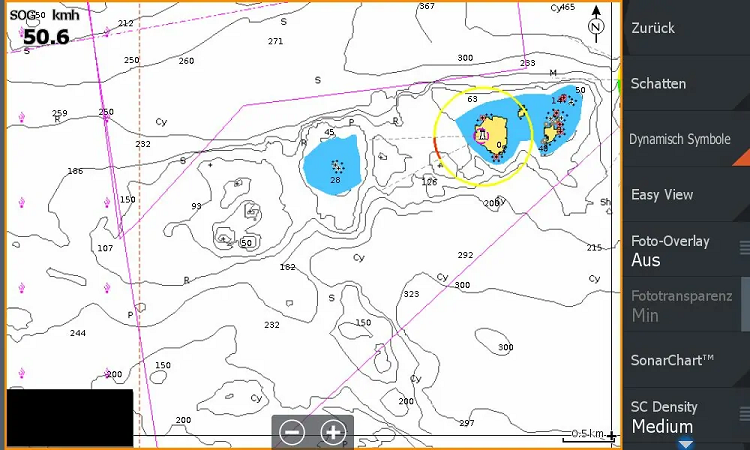
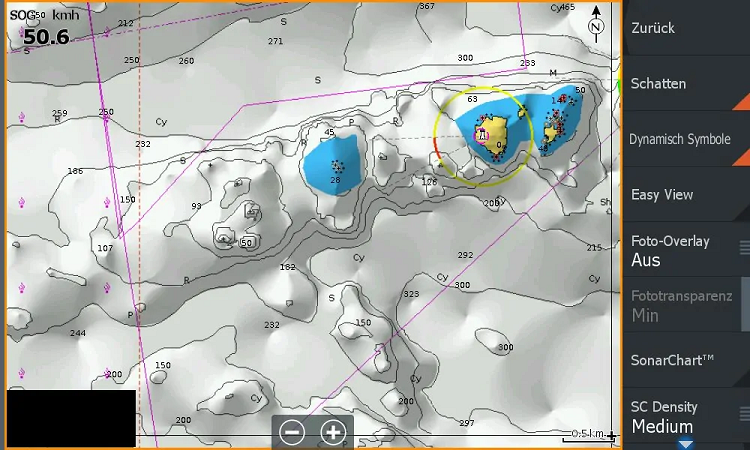
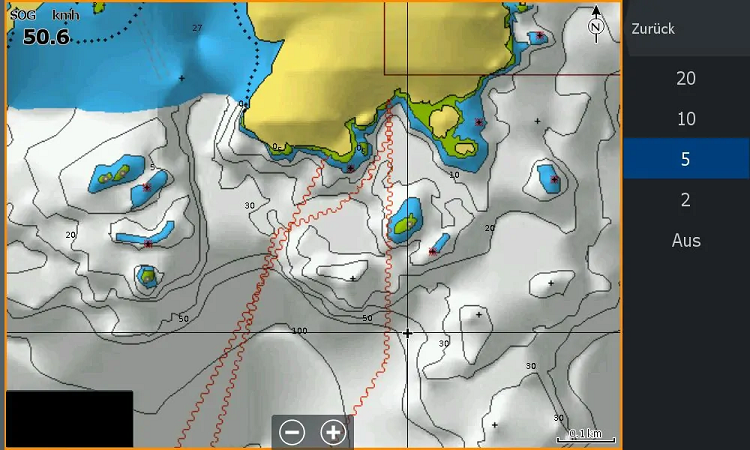
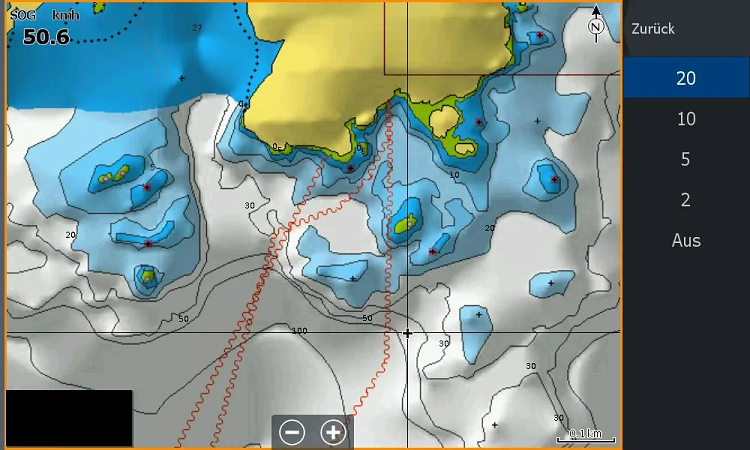
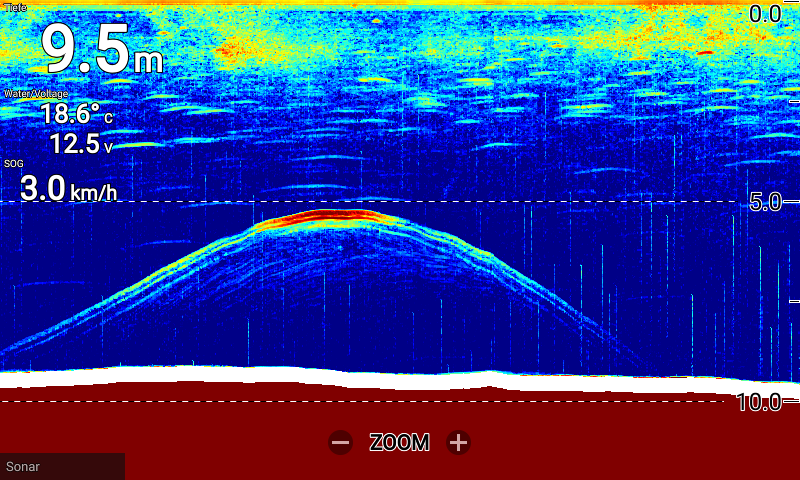
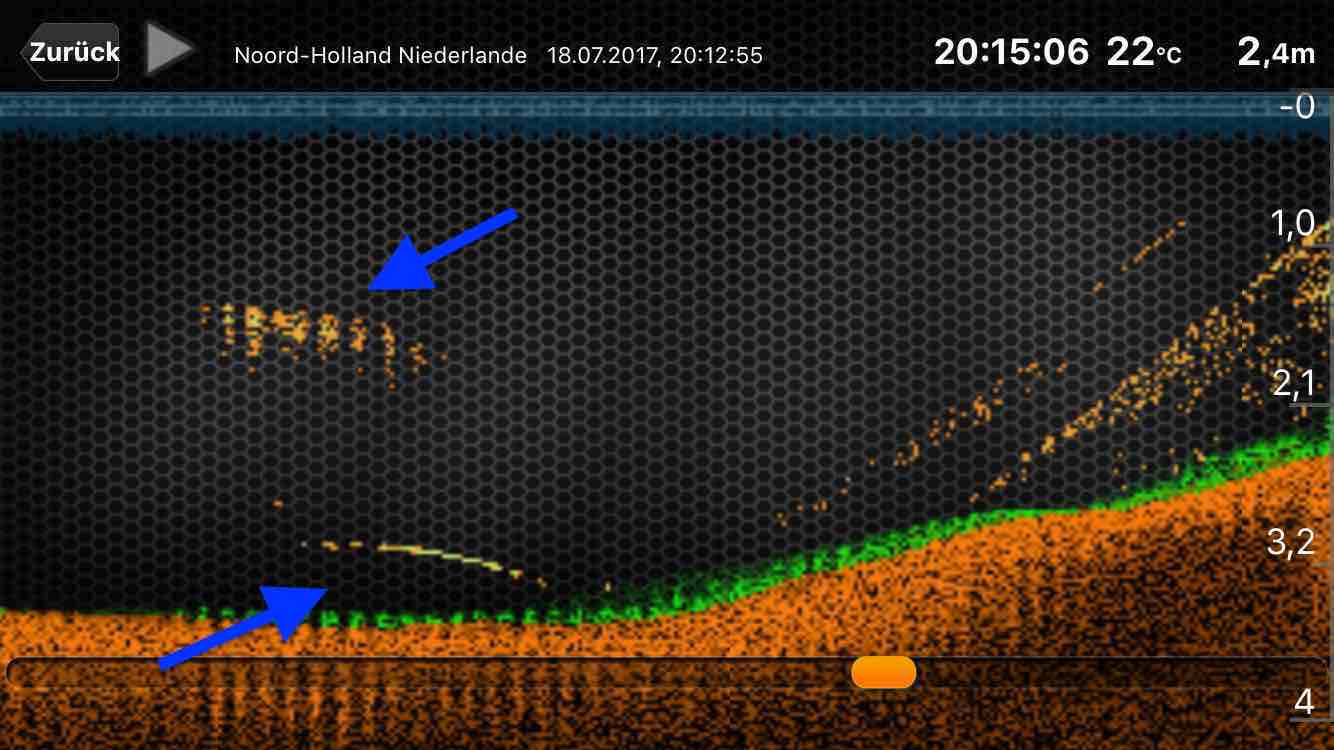
The reason for the different options of the “SC-Density” setting is easy to see: Especially in deep and strongly structured waters, too narrow depth contours make little sense, because this creates a clutter of lines that can hardly be kept track of.
The same setting also affects the already existing Sonarchart lines. Simultaneous display of “Sonarchart” and “Sonarchart Live” should therefore also be avoided, because the result is the very same line salad.
Unfortunately, we had to realize that the Sonarchart lines are not as accurate as we had imagined and wished. Actually, they are mostly just clumsy interpolations between two larger depth lines from the navigation chart (e.g. 40 and 50 m).
For clarification: What is interpolation?
A few words about interpolation, the process that produces the depth contours in the end: The underlying raster interpolation remains invisible, but actually it is exactly from this that the depth contours are produced.
Even though Navionics keeps the exact process secret, one could conclude that it is kriging. The generated trace of depth contours extends 20 m to both sides. That is a lot of timber for a line of exactly vertical data.
From this follows then, one should create if possible under 20 m – or even 10 m – to the existing trace the next parallel. In practical use, this will often not really be possible, resulting in the well-known holes in the mapping.
So if you have logged a certain area, you need to know that all data at the edge should be interpreted with caution, as they lack the interpolation partner, so to say.
The same applies to shoreline areas, because the Sonarchart Live does not interpolate against shorelines. Even if these are present in the original nautical chart, are displayed and would actually be suitable for it.
Thus Sonarchart Live behaves similarly to Autochart or Quickdraw. The interpolation against the shore is probably only done by Navionics when the data has been transmitted in advance and the result is then made available via an online update (similar to e.g. C-Map Genesis).
How do Sonarchart Live, Garmin’s Quickdraw and Humminbird Autochart Live differ?
Competition-wise, we rate it as follows:
- Humminbird’s Autochart Live seems better than Sonarchart Live, partly because of its color usage.
- Sonarchart Live seems better than Garmin’s Quickdraw because the map is really instantaneous (i.e. live). As well as, for many very important, here meter values are used instead of feet.
- However, Navionics and Navico could quickly equal or even pass the competition, if they overcome the aforementioned limitations.
How exactly is the reference to the colors to be understood?
Well, usually the Sonarchart overlay is created in the form of labeled black lines on a white background (without transparency settings). With the “Sonarchart Live Options” settings, you can create graduated red depth areas in shallow water.
In principle, this helps with orientation. However, in our opinion, there is still room for improvement in terms of the number of available colors or color palettes.
Lowrance HDS echo sounders should actually be able to do much more technically!
A fat minus is given for the still not resolved problem that no chart updates can be generated with certain echo sounders.
Therefore you have to use gpx files for a later chart update via the Navionics PC software “Chart Installer”, since the Sonarchart Live files stored on the chart or possibly SL2/SL3 files recorded on another microSD card are not accepted. Thus, you have to export a gpx file from your track data to the Navionics SD card.
However – with various transducers (such as the Airmar TM150M) this does not work at the moment, because unlike the Lowrance standard transducer with 200 kHz, no depth values are stored in a gpx file exported from the HDS. However, we cannot quite understand why this is the case. A technical reason for this restriction does not exist, at least from our point of view.
How long does the update of the Navionics Chart Installer take?
The processing of the map update after sending a correct gpx file with depth values should take about a week. One problem with very large maps like the “Norway Northwest” is that only one complete update is possible at a time, which should be under 2 GB in size.
It remains a mystery why here it is not checked tile by tile, what can remain and what must be updated on the map. Perhaps this is due to an internal data structure. We do not know the answer to this question.
These small and large technical problems have therefore led us to also co-record log data as SL2/SL3 in order to process them later in Reefmaster in the way that suits us best. The additional recording of the logs worked without any problems during the test and simultaneously to the running Sonarchart Live.
In the end, however, we kept asking ourselves:
Why does Navico not release the option of live generated maps for higher-priced devices, but restricts this to a combination with bought Navionics maps?
In our opinion, this means a clear competitive disadvantage to competitors such as Garmin or Humminbird. These offer similar functions free of charge or at least with much less financial effort.
We can only assume that possibly patent-legal, actually technical or completely simple “Know How” aspects play a role here. It seems that Navico has only licensed and uses the Navionics functions and libraries. However, Navico has no ambitions to develop these functionalities themself and to integrate them into its devices.
Maybe this will change with the purchase of Navionics by Garmin. We wish it in any case, because then the purchase of an external fishing map would be omitted. Whether Navico will provide this function free of charge in the further consequence, however, is rather questionable.
Conceivable would be, for example, a link to the now spun off “C-MAP Genesis”. For example, in the form of a premium subscription to cross-subsidize the whole thing. The nicest thing would be of course a free distribution – one may still dream 🙂
But now let’s continue with the test: The new function “colored track lines according to speed over ground” proves to be particularly useful with the HDS devices. You can easily distinguish between areas that have already been fished and those that have simply been driven over. This is extremely helpful, for example, for a new approach to drifting.
There is one disadvantage that should be mentioned for Sonarcharts Live: If you hide the respective track once – or create a new one – then the color gradations disappear and only a monochrome line remains. Maybe Navico should improve this to preserve the information permanently.

Conclusion: Fishing in Norway with Navionics nautical charts
All in all, the Navionics Platinum+ map for Norway in combination with the newer HDS echo sounders represents added value. However, the customer can only take advantage of this combination, if he is willing to pay the high price for the map material.
Of course, cheaper maps with the same features but smaller coverage areas like the one tested here from Navionics are also available.
The use value is mainly due to
- very useful settings for depth ranges,
- several thematic maps and overlays,
- and especially the shadow and Sonarchart Live functions.
- The chart material as a whole is also very helpful, because it actually shows structures in the water that other chart manufacturers cannot show.
The combination of the Navionics map with the HDS Carbon (This should also be able to apply to the Gen3, as already mentioned.) has a number of minor limitations, perhaps for technical or marketing reasons.
However, since the market does not sleep and Humminbird in particular is a strong competitor in live generated fishing maps, both the map provider as well as the device manufacturer should quickly work on further improvements.
Really controversial are our opinions regarding the costs of the Platinum+ Map. While Jörg, as a seasoned Norway angler, sees the purchase price somewhat more positively, as he noted a concrete benefit in some aspects. Luke, for whom Norway is not an issue and is more attached to the inland waters here in Germany obviously has a different opinion: There are enough maps for Lowrance and Simrad in the “Social Map” sector from C-MAP to Genesis available for free download.
Luke sees the money therefore better invested in the purchase of a Garmin Striker, for example, which can do Quickdraw, when it comes to live mapping. Because at Garmin there is Quickdraw already available in the new Striker Plus series from an MSRP of less than 200 dollars on. Luke would rather work with a second device, while Jörg rather appreciates the integration in one device.
Both agree, however, that if Navico were to integrate the live mapping function without Navionics, there would be no need for another device or the actual Navionics map. And the money could be better invested in a bigger screen, for example. Then the paid Navionics map would be reduced to its visualization of specific areas and could only be compared to other offers without special functions.

Raphaël G
Vladimir M
NICHOLAS JOHN REECY
Henrik
Dr. Manfred Marx
Andreas Witz
AK
Lübbe Wolfgang
Kalksee
Enrico Indelicato
Udo
Josef Weiss
Peter
Holger Just
Matthias Wappler
M. Hermanns
TACKLEFEVER